Band 4.0 IELTS Writing Task 1 Model Answer
Overall Band Score: 4.0 · IELTS Momentum Workout · 2026-11-10
IELTS Writing Task 1 question
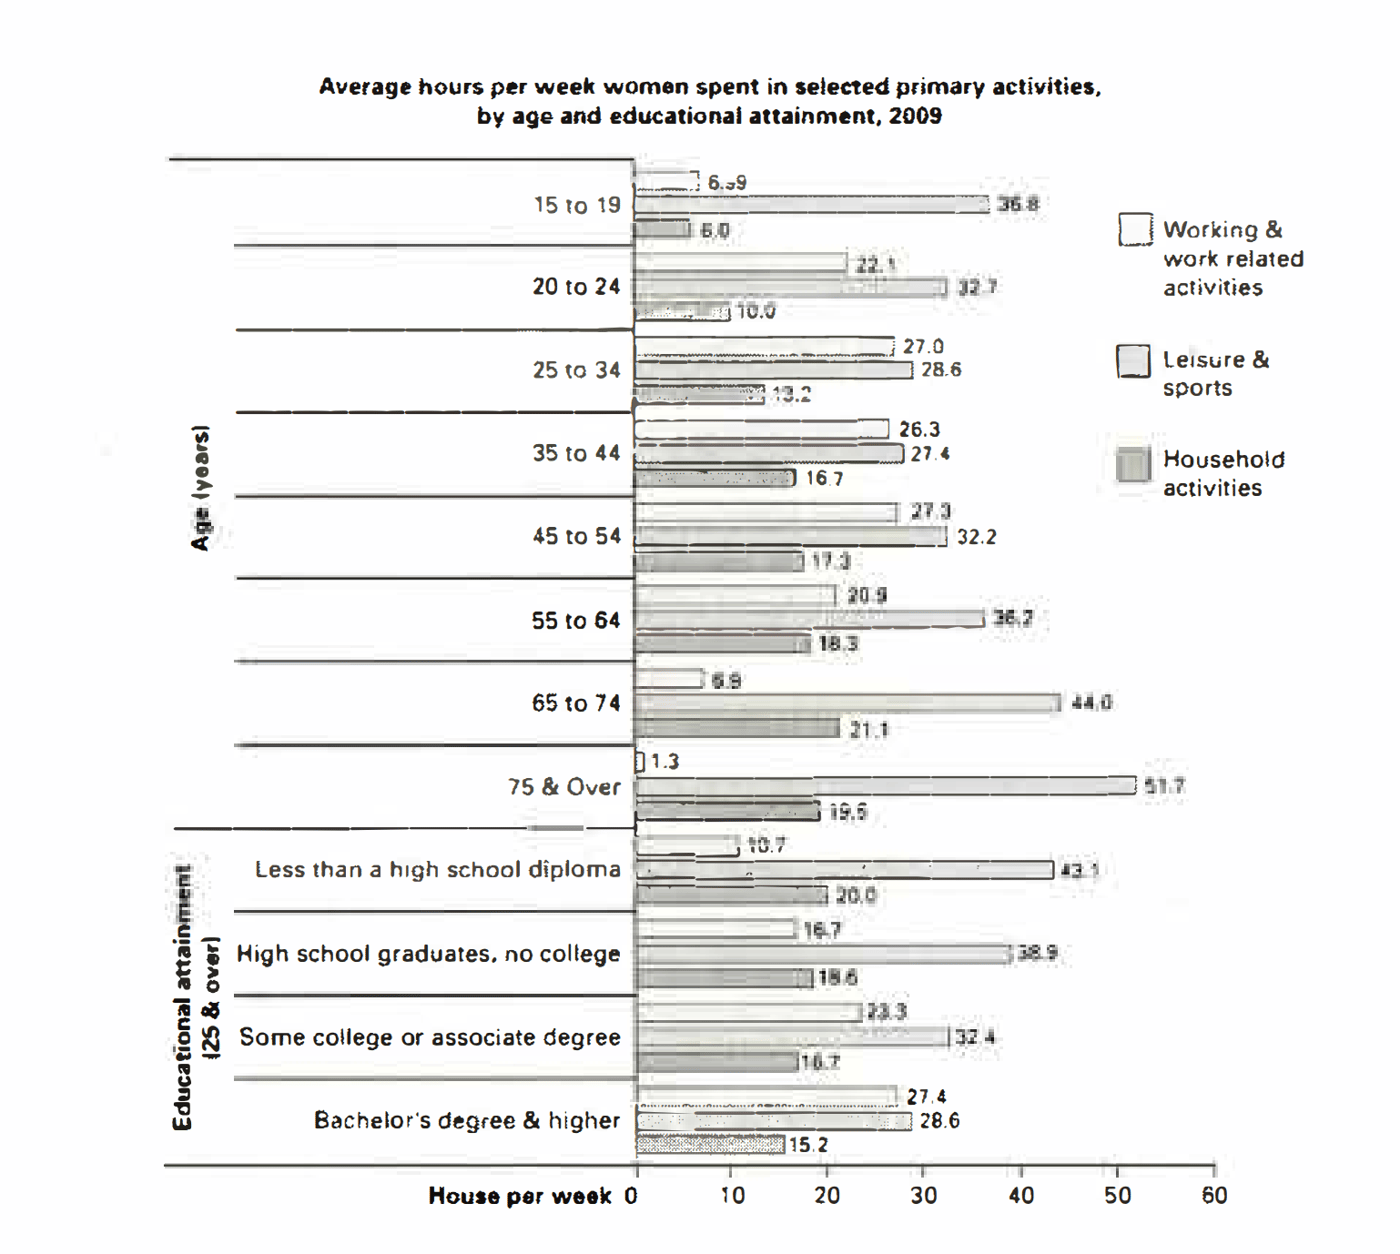
The bar chart below shows the average number of hours that women in various age groups and women with varying levels of education spend on primary activities each week.
Summarise the information by selecting and reporting the main features, and make comparisons where relevant.
Average hours per week women spent in selected primary activities, by age and educational attainment, 2009
Student answer (Band 4.0)
The image illustrate bar chart of average number of hours that women in different age groups and women with different levels of studies spend on primary activites each week.
The bar chart gives information of average hours per week spent in selected primary activites by age and education attainment 2009 which divide the information in two information ages which gives the information og ages and other gives information which also having education while spent other activites in the x represent ages and education attainment and y axis represent house per week, the highest is age of 75 and over of leisure and sports house per week also the lowest working and work related activites ,The education attainment highest less than a high school diploma leisure and sports is the highest in that bar lowest is working and work related of hourse per week.
AI examiner evaluation
| Criterion | Band |
|---|---|
| Task Achievement / Task Response | 3.5 |
| Coherence and Cohesion | 3.5 |
| Lexical Resource | 4.5 |
| Grammatical Range and Accuracy | 4.5 |
| Overall | 4.0 |
Task Achievement / Task Response: Band 3.5
You identify the chart’s two groupings and mention relevant extremes, including women aged 75 and over having the most leisure time and women with less than a high-school diploma having the most leisure time among education groups. However, the response gives almost no accurate numerical detail or meaningful comparisons, and it does not provide a clear overview of the main patterns across the chart. The statement that the lowest figure is working time is ambiguous: the minimum is 1.3 hours for women aged 75 and over, while the education-group minimum is 10.7 hours for those without a high-school diploma. The response is also 7 words below the required minimum. To improve, report several key figures and contrasts, and summarise the broad trends for age and education.
Coherence and Cohesion: Band 3.5
There is a basic attempt to introduce the chart and refer to its age and education sections, but the information is not arranged into a clear summary. The second sentence is extremely long and combines the chart description, axis information and several comparisons, so the reader has difficulty following the progression. Phrases such as “which divide the information in two information ages” and the repeated use of “also” do not clearly connect the ideas. Separate the response into an introduction, an overview of the main patterns, and a short paragraph comparing selected figures. Use clear links such as “By contrast” or “Regarding education” only where they accurately show the relationship between points.
Lexical Resource: Band 4.5
The response uses some relevant chart vocabulary, including “average,” “age groups,” “education attainment,” and “leisure and sports,” so the topic is generally recognisable. However, the range is narrow and several words or phrases are repeated, especially “information,” “highest,” and “working and work related activities.” Spelling errors such as “activites” and “hourse” also reduce accuracy, while phrases such as “education attainment highest” are not natural collocations. Aim for precise reporting language and vary expressions—for example, “accounted for,” “spent,” “figure,” and “category.” Check spelling and use the chart’s labels consistently, such as “educational attainment” and “household activities.”
Grammatical Range and Accuracy: Band 4.5
You attempt to combine ideas in longer sentences, but control is inconsistent, and the response relies heavily on one extended sentence rather than showing a range of well-formed structures. For example, “The image illustrate” has a subject–verb agreement error, and “which divide the information” also has incorrect agreement and an unclear clause structure. The phrase “the x represent ages and education attainment and y axis represent house per week” lacks articles and has agreement errors. These problems make several relationships difficult to understand. Build accuracy first with clear simple sentences, then add controlled comparisons using structures such as “while” or “whereas.” Check agreement, articles, and sentence boundaries during revision.
See this exact question answered at other band scores. The same prompt compared across bands.
Browse more IELTS Writing model answers or get your own writing scored by the same AI examiner.