Band 6.0 IELTS Writing Task 1 Model Answer
Overall Band Score: 6.0 · IELTS Momentum Workout · 2026-11-12
IELTS Writing Task 1 question
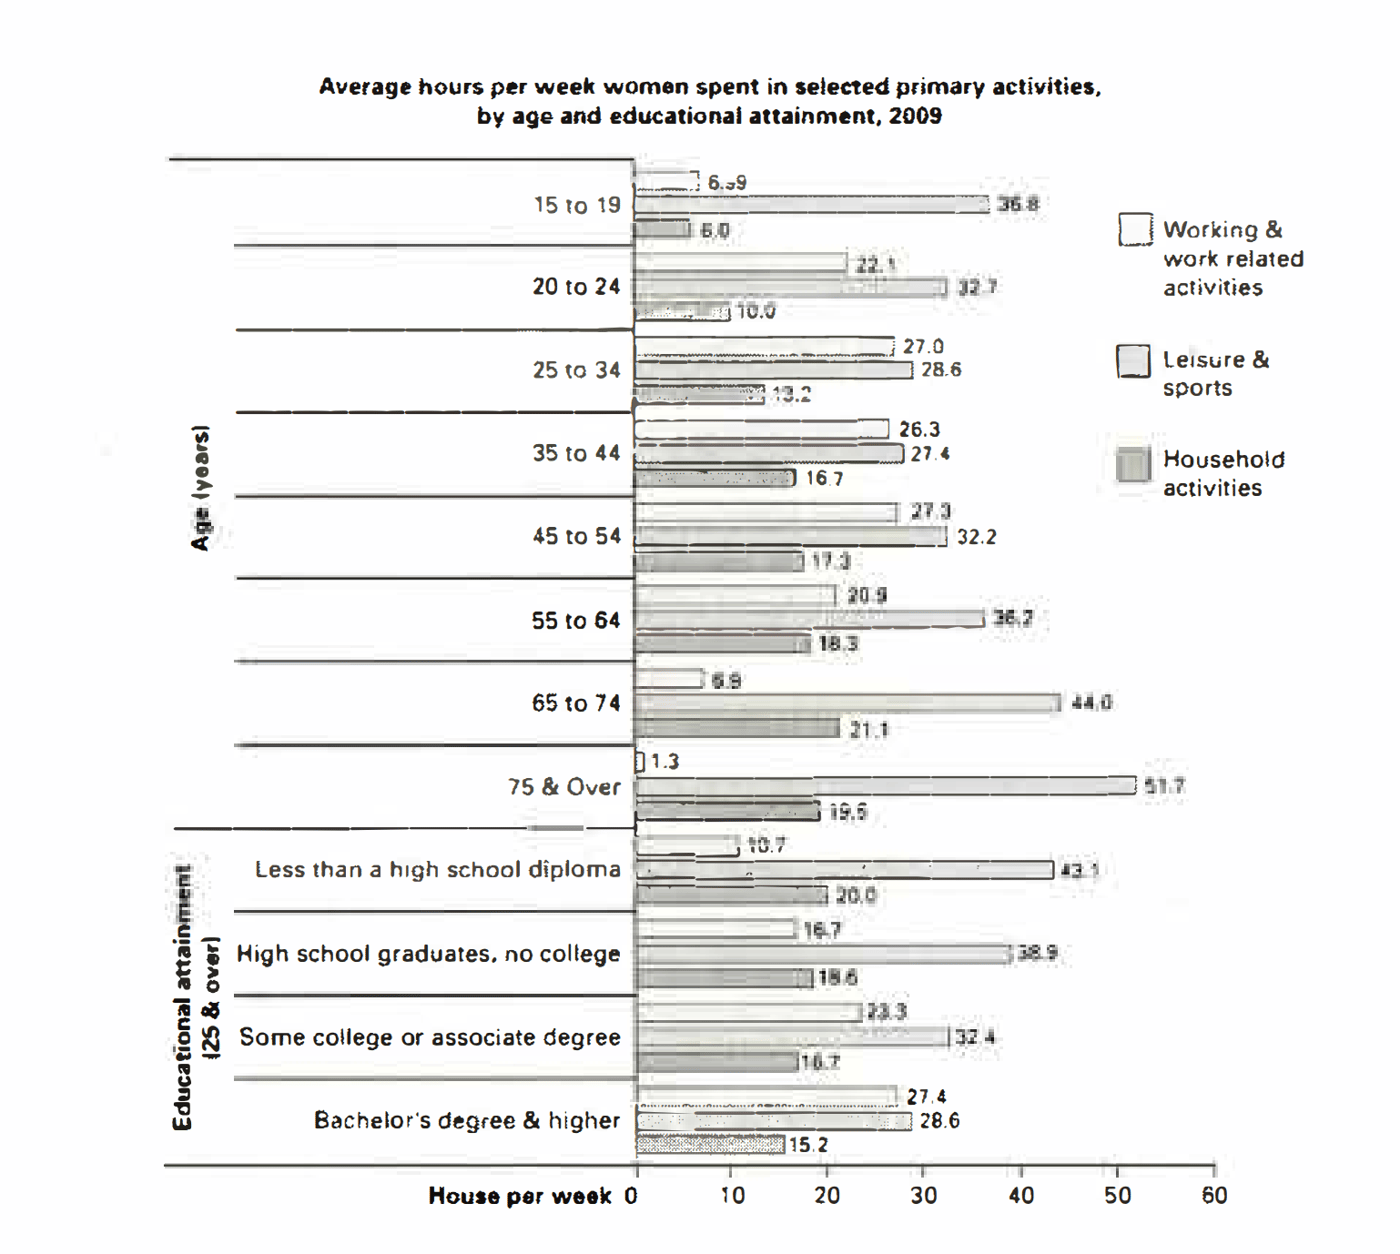
The bar chart below shows the average number of hours that women in various age groups and women with varying levels of education spend on primary activities each week.
Summarise the information by selecting and reporting the main features, and make comparisons where relevant.
Average hours per week women spent in selected primary activities, by age and educational attainment, 2009
Student answer (Band 6.0)
The bar chart shows us various kinds of activities that women belonging to different age group and levels of education spend time on weekly.
The bar chart mainly focuses on three different kinds of activities and they are working and work related activities , leisure and sports and household activities which are represented using diffrerent colours on the bar graph. Different age groups are also shown on one side of the bar graph and the educational qualification section consisting data for women 25 and above is also shown on the same side. A line representing the average hours spent per week runs along the bars.
The highest time spent on leisure and sports are the women belonging to age groups of 75 and over and 65 to 74 which are relatively the oldest age groups showcased in the bar graph , the oldest group spends around 51.7 hours a week which is the highest . One common occurance is that women spend most time on leisure and sports regardless of the age group. The age group of 65 to 74 spends highest time on household activities while the younest group spends the least. The time spent on working related activities is very similar from the age group of 20 to 24 up until 55 to 64 after which we see a sharp drop to 6.9 from 20.9 . The age group of 45 to 54 spends the most time on working and working related activities while the oldest group 75 and over spends the least time.
Women with less than a high school diploma spend the most amount of time on leisure and sports while women with bachelor's degree and higher spend the least amont of time on leisure and sports , the reduce in time spent on leisure and sports is gradual as the educational qualification increases. Women with bachelor's and higher spend more time working while women with less than a high school diploma spend the least. least educated group spends the most time on household activities while the highest educated group spends the least.
AI examiner evaluation
| Criterion | Band |
|---|---|
| Task Achievement / Task Response | 6.0 |
| Coherence and Cohesion | 6.0 |
| Lexical Resource | 5.5 |
| Grammatical Range and Accuracy | 5.5 |
| Overall | 6.0 |
Task Achievement / Task Response: Band 6.0
You identify the chart’s three activities and report several important patterns, including the peak in leisure time among women aged 75 and over and the rise in household activity with age before a slight fall in the oldest group. You also compare educational groups, correctly noting that higher education is associated with more work time and less leisure and household time. However, some comparisons are inaccurate or imprecise: women aged 45–54 do not spend the most time working; the 25–34 and 45–54 groups are tied at 27 hours, slightly above 35–44. The 65–74 group does not have the highest household figure; its 21.1 hours is the peak, but this is worth stating explicitly. A concise overview of the main contrasts and more precise reporting would strengthen the response.
Coherence and Cohesion: Band 6.0
The response has a clear overall sequence: an introduction, a description of the chart, then discussion of age and educational attainment. This makes the information generally easy to follow, and phrases such as “One common occurrence” and “while” help signal comparisons. However, the second paragraph spends considerable space describing the chart’s presentation rather than organising the data into key trends. Some links are also abrupt: the discussion moves from age patterns to education without a clear transition, and the final education comparisons are compressed into a run of statements. Grouping related figures into more focused paragraphs and using an explicit overview would create stronger progression. Check that references such as “the oldest group” and “the least educated group” remain unambiguous.
Lexical Resource: Band 5.5
You use relevant vocabulary for describing the chart, including “leisure and sports,” “household activities,” “sharp drop,” and “gradual,” so the main comparisons are understandable. There is some repetition of “spend time,” “group,” and “time spent,” and several phrases are awkward or imprecise, such as “the reduce in time” and “the highest time spent.” Spelling errors, including “diffrerent,” “occurance,” “younest,” and “amont,” also reduce accuracy. Aim for more natural data-reporting collocations and vary the language used to describe amounts and trends. For example, “account for” or “record” can replace repeated forms of “spend,” while “decline” is more suitable than “reduce” when naming a downward trend.
Grammatical Range and Accuracy: Band 5.5
You attempt a mix of simple and complex sentences, including comparisons with “while” and clauses such as “after which we see a sharp drop.” Most of the meaning remains clear, but some grammatical errors and punctuation problems are noticeable. For example, “The highest time spent on leisure and sports are the women” has faulty agreement and sentence structure; a clearer form would be “Women aged 75 and over spend the most time on leisure and sports.” The sentence beginning “The age group of 65 to 74 spends highest time” is also missing an article before “highest.” Commas are often missing around clauses, and spaces appear before commas in places. More consistent sentence construction and careful proofreading would improve accuracy while preserving your range.
See this exact question answered at other band scores. The same prompt compared across bands.
Browse more IELTS Writing model answers or get your own writing scored by the same AI examiner.