Band 5.0 IELTS Writing Task 1 Model Answer
Overall Band Score: 5.0 · IELTS Momentum Workout · 2026-11-13
IELTS Writing Task 1 question
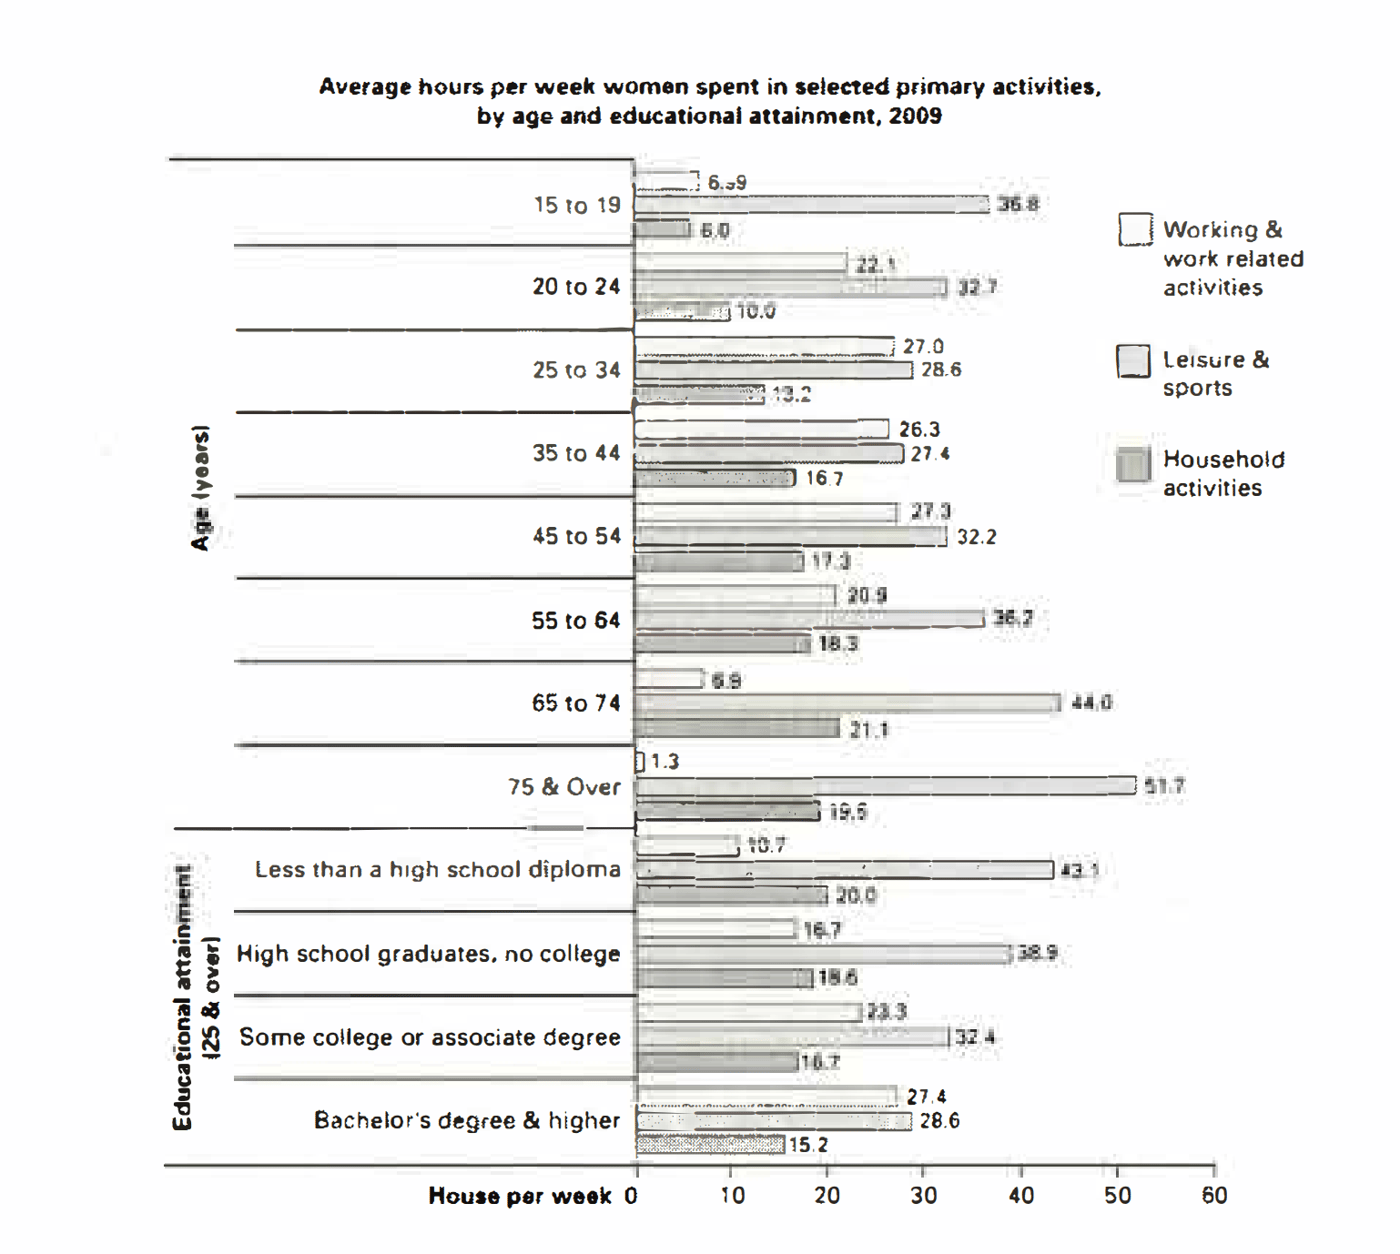
The bar chart below shows the average number of hours that women in various age groups and women with varying levels of education spend on primary activities each week.
Summarise the information by selecting and reporting the main features, and make comparisons where relevant.
Average hours per week women spent in selected primary activities, by age and educational attainment, 2009
Student answer (Band 5.0)
The given bar chart elucidates information about the average number of hours that women in various age groups and women with varying levels of education spend on primary activities each week. The chart compares different categories and presents the data in numbers for proper illustration.
Overall, it is evident that there are noticeable differences among the categories shown in the chart , furthermore household activities 51.7 appeared to be the highest, while 6.0 was the lowest. In addition, all categories showed mixed results with some fluctuations with stability, increment as well as decrement.
Talking about working and work related activities, its values were quite interesting like house per week from 15 to 19 6.9 for working, 36.8 for leisure, 6.0 for household activities, from 20 t0 24 about 22.1 for work, 32.7 for leisure, 10.1 for household activities.
For some more understanding headings towards 25 to 34, it had values 27.0 for work, 28.6 for leisure, 13.2 for household. about 35 t0 54, 27.3 was the highest working activities, and 13.2 was the low average. pouring some light 75 and over, and its share was 1.3 for working, 51.7 for leisure, and the 19.6 for household.
AI examiner evaluation
| Criterion | Band |
|---|---|
| Task Achievement / Task Response | 4.0 |
| Coherence and Cohesion | 4.5 |
| Lexical Resource | 5.5 |
| Grammatical Range and Accuracy | 5.0 |
| Overall | 5.0 |
Task Achievement / Task Response: Band 4.0
The response makes a limited attempt to describe the chart, but its main overview is inaccurate: it says household activities at 51.7 hours was the highest, whereas 51.7 refers to leisure among women aged 75 and over. The lowest figure, 6.0, is household activity for ages 15–19, but the response does not identify the broader patterns clearly. It reports a few figures for younger age groups and the oldest group, yet omits most age bands and all educational-attainment comparisons. The statement that work was highest at 27.3 for ages 35–54 is also imprecise; the chart gives 27.0 for both 25–34 and 45–54, and 26.3 for 35–44. Select the key trends accurately and compare both chart sections.
Coherence and Cohesion: Band 4.5
There is some basic organisation: an opening, an overview, and a paragraph that begins to report figures. However, the progression is difficult to follow because the body moves between activities and age groups without a clear comparison or consistent structure. Phrases such as “Talking about working” and “For some more understanding headings towards” do not clearly signal how the information is being organised. The overview also combines unrelated claims, and the final sentence abruptly focuses on the oldest group. Use a clear sequence—for example, summarise age-related patterns first, then educational patterns—and connect each figure to the trend it illustrates. More precise referencing would help readers understand which activity and group each number describes.
Lexical Resource: Band 5.5
The response uses some task-related vocabulary, including “average,” “categories,” “fluctuations,” and “increment as well as decrement,” so the topic is generally recognisable. However, several choices are unnatural or imprecise for describing a chart. “Elucidates information” and “proper illustration” are unnecessarily elaborate, while “pouring some light” is an incorrect expression and “share” does not accurately describe hours per week. “House per week” also appears to be an unsuitable word choice. Repeated use of “values” and “activities” limits precision, and the inaccurate labels make the data harder to interpret. Prefer straightforward reporting language such as “shows,” “hours spent,” “rose,” and “fell,” and use the exact activity names from the chart.
Grammatical Range and Accuracy: Band 5.0
The response attempts a few longer sentence forms, including the opening sentence and the overview beginning “Overall, it is evident,” but control is inconsistent. The overview contains faulty punctuation and sentence joining: “there are noticeable differences …, furthermore household activities…” should be separated or joined with a suitable conjunction. Several data statements are fragments rather than complete sentences, such as “from 20 t0 24 about 22.1 for work,” and “about 35 t0 54, 27.3 was the highest working activities.” The construction “from 15 to 19 6.9 for working” also lacks a clear grammatical link between the age group and figures. Build complete sentences with a subject and verb, and use punctuation to separate comparisons clearly.
See this exact question answered at other band scores. The same prompt compared across bands.
Browse more IELTS Writing model answers or get your own writing scored by the same AI examiner.