Band 5.0 IELTS Writing Task 1 Model Answer
Overall Band Score: 5.0 · IELTS Momentum Workout · 2026-11-15
IELTS Writing Task 1 question
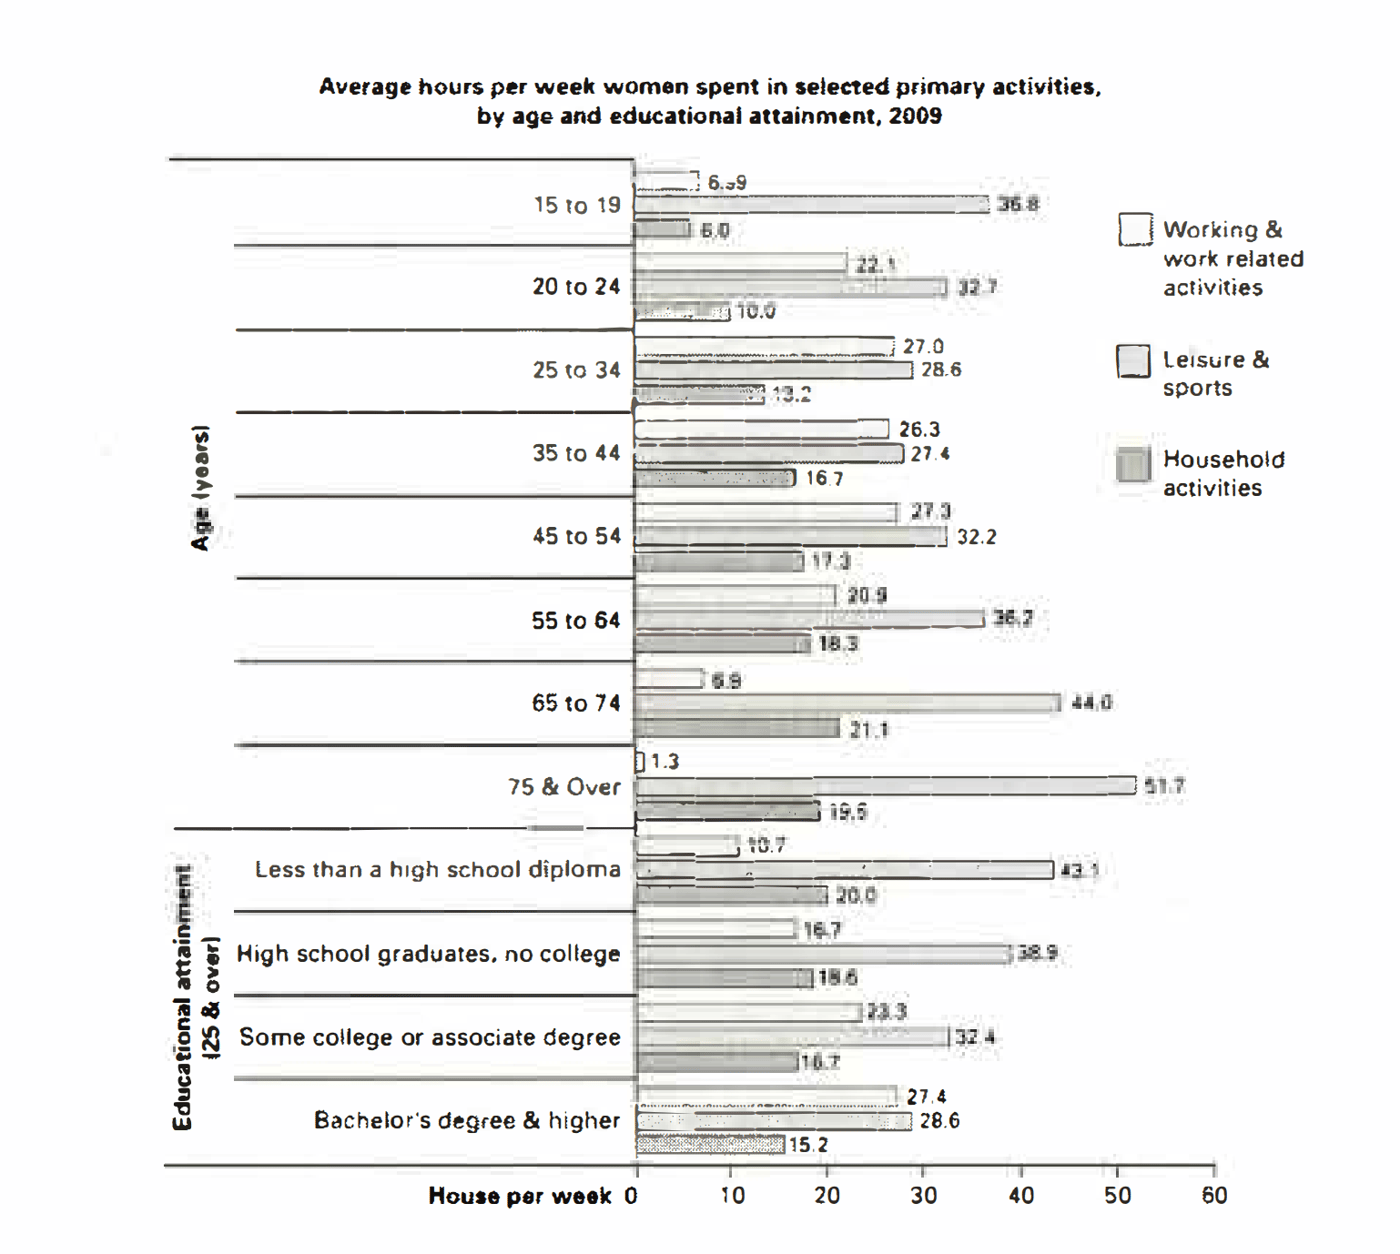
The bar chart below shows the average number of hours that women in various age groups and women with varying levels of education spend on primary activities each week.
Summarise the information by selecting and reporting the main features, and make comparisons where relevant.
Average hours per week women spent in selected primary activities, by age and educational attainment, 2009
Student answer (Band 5.0)
The bar chart illustrates the varitey of activties performed by females, based on their education and age. How much average time they spend on these activies per week.
Overall, this graph represent the activities of women. Firstly the selection of activity, such as, jobs and job related activities, leisure and sports, household activities. On the other hand selection on basis of educational attainment, for example high school diploma, graduates ,some college or associate degree, bachelor's degree or higher.
According to age groups women shows different interest in different fields, likewise, 15-24 age group are mostly interested in leisure and sports with 36.8%-32.7% women are engaged in these activities. Working women in early years are few to moderate about 6.9-22.1% and only 6.0-10%fewer groups are doing household chores. Middle age group women preferences changes, working and work related activities are continously increasing, almost 27% are working. The figure of sports remain stable (32%) and more household activities are performed.In old age work and related activities are lowest, household activities are moderate and leisure are longest.
women with education spend their times largest part in work related activities and large part in leisure and sports activities
AI examiner evaluation
| Criterion | Band |
|---|---|
| Task Achievement / Task Response | 4.5 |
| Coherence and Cohesion | 5.0 |
| Lexical Resource | 5.0 |
| Grammatical Range and Accuracy | 5.0 |
| Overall | 5.0 |
Task Achievement / Task Response: Band 4.5
You identify the chart’s three activity categories and make some relevant comparisons across age groups, including the high leisure figures among younger women and the low amount of work among older women. However, the response only partially reports the main features. The overview is mostly a description of the chart’s categories rather than a clear summary of its key patterns, and the education section is especially limited: it says women with education spend the largest part of their time on work and leisure, without comparing attainment levels or noting that work rises while leisure and household time generally fall as education increases. Some details are also inaccurate or unclear, such as saying work is “continously increasing” when it peaks around 25–54 and then declines. Select the strongest trends and support them with accurate figures.
Coherence and Cohesion: Band 5.0
The response has a basic overall structure: an introduction, a general statement, discussion of age groups, and a final point about education. This gives the reader some sense of the chart’s organisation. However, progression is uneven, and the education point is left as a single, undeveloped sentence. Several links are mechanical or unclear, such as “Firstly” and “On the other hand,” which do not express the relationships between the ideas accurately. The long age-group discussion also moves quickly between work, leisure and household activities without consistently signalling the comparisons. Use separate, focused paragraphs for age and education, and connect each comparison explicitly—for example, contrast the rise in household activity with the fall in work among older groups.
Lexical Resource: Band 5.0
You use a minimally adequate range of chart-related vocabulary, including “age groups,” “educational attainment,” “leisure and sports,” and “household activities.” These terms help identify the data being discussed. However, word choice and spelling errors are noticeable and sometimes make the meaning less clear. Examples include “varitey,” “activties,” “continously,” and “preferences changes.” Some expressions are also unnatural for describing a chart: women are said to be “interested in” activities or “engaged” in them, and “the figure of sports remain stable” is imprecise. Prefer neutral reporting language such as “spent time on,” “the amount of time devoted to,” and “remained relatively steady.” More precise verbs and accurate spelling would make the comparisons easier to follow.
Grammatical Range and Accuracy: Band 5.0
You attempt both simple and longer sentence forms, and the reader can generally identify the broad topic of each sentence. However, the range is limited, and errors occur frequently enough to make some relationships difficult to follow. For example, “Overall, this graph represent” has subject–verb disagreement, while “women shows different interest” has the same problem and an unclear sentence pattern. The fragment “How much average time they spend…” is not joined grammatically to the opening sentence. In “Middle age group women preferences changes,” the noun phrase and verb form are faulty, and punctuation is often missing between clauses. Practise building complete sentences with a clear subject and verb, and check agreement, articles and punctuation when combining comparisons.
See this exact question answered at other band scores. The same prompt compared across bands.
Browse more IELTS Writing model answers or get your own writing scored by the same AI examiner.