Band 5.5 IELTS Writing Task 1 Model Answer
Overall Band Score: 5.5 · IELTS Momentum Workout · 2026-11-19
IELTS Writing Task 1 question
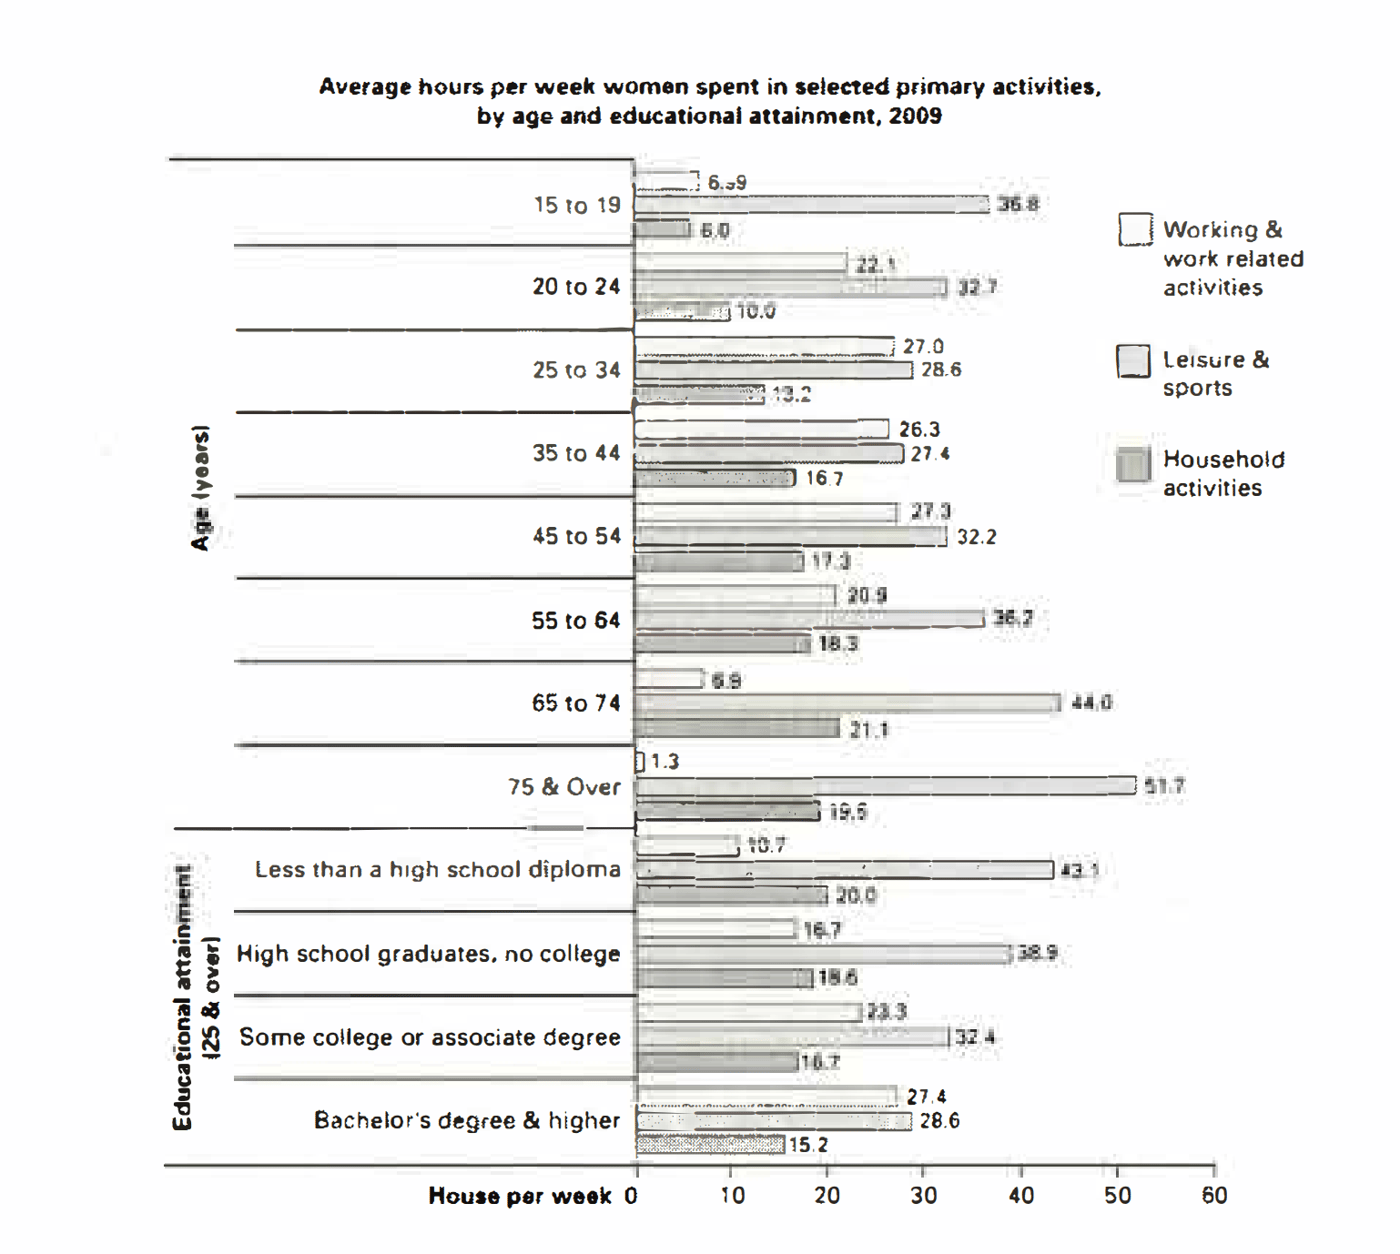
The bar chart below shows the average number of hours that women in various age groups and women with varying levels of education spend on primary activities each week.
Summarise the information by selecting and reporting the main features, and make comparisons where relevant.
Average hours per week women spent in selected primary activities, by age and educational attainment, 2009
Student answer (Band 5.5)
Below chart illustrate the information about the daily activity of women like working related, sport related and household activities, which activity they did at their different different ages.
We saw that when women get older, the percentage of working activities are increased at the age of 64, after that it decressed.If we talking about education purpose, from high school diploma to bachelors degree, work related activities are increased.
Women who are between 15 to 44, leasure and sport activities are decressed and after 44, this activity may increased gradually. If we talking about whomen between studied in high school diploma to bachelor's degree, the ratio of lesure and sport activities are decressed.
If we talking about the household activities, so when the women get older, the ratio of the household activities may increased gradually however in high school diploma to bachelor's degree, this ratio may get decressed.
Allover, graph provide information about a women who did many kind of activity at their different different ages.
AI examiner evaluation
| Criterion | Band |
|---|---|
| Task Achievement / Task Response | 5.0 |
| Coherence and Cohesion | 6.0 |
| Lexical Resource | 5.0 |
| Grammatical Range and Accuracy | 5.0 |
| Overall | 5.5 |
Task Achievement / Task Response: Band 5.0
You identify all three activity categories and make relevant comparisons across age and education, so the response is generally on topic. However, the main features are only partly reported, and some claims are inaccurate or unclear. For example, work-related time does not keep increasing until age 64: it peaks around ages 25–54, then falls sharply. The education comparison is broadly correct, but the chart shows leisure time decreasing as educational attainment rises, while household time also declines. Your overview, “Allover, graph provide information,” does not summarise the most important contrasts, such as leisure being highest among the oldest women and work being highest among degree holders. Select key patterns and support them with accurate figures.
Coherence and Cohesion: Band 6.0
The response has a coherent overall arrangement: it introduces the chart, discusses work, leisure and household activities in separate paragraphs, and ends with a concluding statement. This makes the categories easy to follow. However, progression within the paragraphs is sometimes mechanical because “If we talking about…” is repeated, and the final sentence largely repeats the introduction rather than drawing together the main findings. Some references are also unclear, such as “this activity” and “this ratio,” which require the reader to infer the category being discussed. Use a concise overview after the introduction, then organise comparisons by age and education with clearer linking phrases and explicit references to each activity.
Lexical Resource: Band 5.0
You use relevant chart vocabulary, including “working activities,” “household activities,” “increased,” “decreased” and “gradually,” which allows the reader to recognise the broad subject and trends. However, the range is limited and several word-choice, spelling and collocation errors make the account less precise: “sport related” is not the chart’s category, “ratio” is unsuitable for hours, and “different different ages” is repetitive. There are also noticeable spelling errors such as “leasure,” “decressed” and “whomen.” Build a more accurate set of terms for describing time and comparisons, such as “hours spent,” “rose,” “fell,” “peaked” and “was highest among,” and check spelling carefully.
Grammatical Range and Accuracy: Band 5.0
You attempt both simple statements and longer sentences with clauses, for example, “when the women get older, the ratio … may increased gradually however…” This shows an effort to express trends and contrasts, but the range is limited and complex attempts are often faulty. Errors in verb forms and agreement occur in “the percentage … are increased,” “it decressed,” and “may increased”; the conditional phrase “If we talking” also lacks the required verb form. Articles and sentence construction are inconsistent, as in “Below chart illustrate” and “graph provide information.” Practise accurate present-tense reporting structures, such as “the figure rises,” “it then falls,” and “while household activity increases,” and punctuate contrast clauses clearly.
See this exact question answered at other band scores. The same prompt compared across bands.
Browse more IELTS Writing model answers or get your own writing scored by the same AI examiner.