Band 5.5 IELTS Writing Task 1 Model Answer
Overall Band Score: 5.5 · IELTS Momentum Workout · 2026-11-05
IELTS Writing Task 1 question
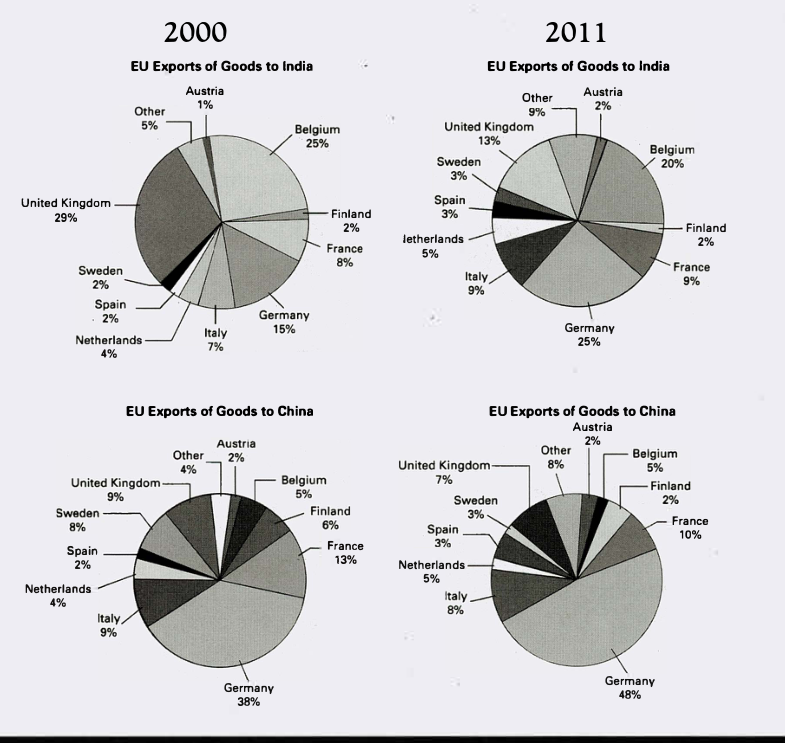
The pie charts below show exports from various EU countries to India and China in 2000 and 2011.
Summarise the information by selecting and reporting the main features, and make comparisons where relevant.
EU Exports of Goods to India and China in 2000 and 2011
Student answer (Band 5.5)
The pie chart illusrates the imports of goods to india and china from EU between 2000 to 2011.
overall, the chart shows that India imports more from every EU countires than China which imports large share of goods from Germany.
In 2000, India was more depended on EU export goods in which the highest number of goods were exported from belgium with 25% after UK with approximately 29% and the least was Austria with less than 2% of goods exported to india.But in 2011 India's had a dramatic shift in good exports by reduction of export goods from belgium from 25% to 20% and Uk's from 29% to just 13%.Germany dominated the chart in 2011 by exporting goods to India around 25%.
China majority of goods are being imported from Germany which is about 38%.The second export highest figure to China is France 13% and the leasts are Spain and Austria with 2 % each in 2000.Moreover in 2011 Germany still donimates the graph with a hike to 48% of exporting goods to China and the least number of percentage of exporting good to China are Austria and Finland with 2 % each.
AI examiner evaluation
| Criterion | Band |
|---|---|
| Task Achievement / Task Response | 5.5 |
| Coherence and Cohesion | 6.0 |
| Lexical Resource | 5.5 |
| Grammatical Range and Accuracy | 5.5 |
| Overall | 5.5 |
Task Achievement / Task Response: Band 5.5
You identify several important features, including Germany’s leading share of exports to China and the fall in the UK’s share of exports to India. The figures you give for these points are accurate, and you include both years and destinations. However, the overview is not reliable: “India imports more from every EU countries than China” cannot be concluded from percentage shares, and the charts show the distribution of each destination’s exports, not total amounts. Some details are also incomplete: for example, Germany’s share of China-bound exports rose from 38% to 48%, while the overview does not capture this change. Select the main contrasts and describe shares precisely, avoiding claims about total imports or dependence that the charts do not establish.
Coherence and Cohesion: Band 6.0
The response has a recognisable structure: an introduction, an overview, and separate paragraphs for India and China. This makes the two destinations reasonably easy to follow, and linking expressions such as “Moreover” and “But” help signal relationships. However, the overview does not clearly summarise the main patterns, and the body paragraphs mainly list details rather than building a consistent comparison across the two years. Some transitions are awkward, such as “But in 2011 India's had,” and punctuation spacing makes several sentences run together. A clearer overview followed by one paragraph comparing India’s changes and another comparing China’s would create more logical progression and make the links between figures easier to follow.
Lexical Resource: Band 5.5
You use some relevant task vocabulary, including “exported,” “share,” “dominated,” “reduction,” and “hike,” and the reader can generally understand the comparisons. However, word choice and collocation are often inaccurate or repetitive. “India was more depended on EU export goods” does not express the chart data clearly, while “the second export highest figure” and “least number of percentage” are unnatural. There are also spelling errors in words such as “illusrates,” “donimates,” and “countires.” Use precise terms such as “accounted for,” “share,” and “proportion,” and vary the wording without using expressions like “hike” where a neutral description such as “increase” is more suitable.
Grammatical Range and Accuracy: Band 5.5
You attempt both simple and more complex sentences, including comparisons across years and clauses introduced by “which” and “while.” The main information is usually understandable, but some grammatical errors recur. For example, “between 2000 to 2011” uses the wrong preposition pattern, and “India's had a dramatic shift” has an incorrect subject construction. There are also problems with articles, plurals, and agreement in phrases such as “every EU countires” and “China majority of goods are being imported.” Sentence boundaries and punctuation are sometimes unclear, as in “to india.But.” Work on accurate sentence patterns and consistent past-tense reporting; this will make your comparisons clearer while preserving the range you are attempting.
See this exact question answered at other band scores. The same prompt compared across bands.
Browse more IELTS Writing model answers or get your own writing scored by the same AI examiner.