Band 5.5 IELTS Writing Task 1 Model Answer
Overall Band Score: 5.5 · IELTS Momentum Workout · 2026-11-06
IELTS Writing Task 1 question
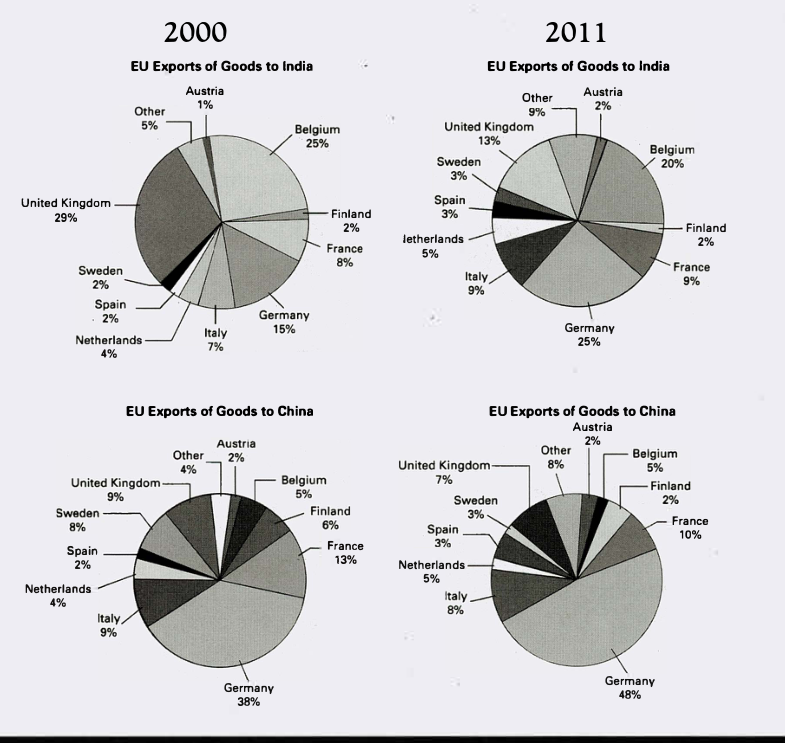
The pie charts below show exports from various EU countries to India and China in 2000 and 2011.
Summarise the information by selecting and reporting the main features, and make comparisons where relevant.
EU Exports of Goods to India and China in 2000 and 2011
Student answer (Band 5.5)
The pie charts gives the propotions of exports of goods from various countries in the EU to India and China in 2000 and 2011.
Overall, Belgium exported second largest percentage to India over the years with Finland delivering the least. In China, Germany was the led exporter of goods in both years followed.
Most of the googd to China were from Germany with 38% in 2000 and 48% in 2011 followed by France 13% and 10% respectively. Austria and Spain delivered the smallest percentage at 2% each in 2000 whereas in 2011, Finland and Austria recorded the sama percentage.
In United Kindom dominated exports in 2000 by 29% followed by Belgium and Germany at 25% and 15% respectively. Finland, Sweden and Spain had only 2% each while Austria had the least percentage at 1%. In 2011 Germany had the most export at 25% overtaking the UK and Belgium. Austria and Finland supplied 2% of of goods respectively.
AI examiner evaluation
| Criterion | Band |
|---|---|
| Task Achievement / Task Response | 5.0 |
| Coherence and Cohesion | 5.5 |
| Lexical Resource | 5.5 |
| Grammatical Range and Accuracy | 5.0 |
| Overall | 5.5 |
Task Achievement / Task Response: Band 5.0
You identify the main contrast that Germany led exports to China in both years, and you report its rise from 38% to 48%. You also select several relevant figures for India, including the UK’s 29% share in 2000 and Germany’s 25% in 2011. However, the overview is incomplete and partly inaccurate: Belgium was not the second-largest exporter to India in both years, since Germany ranked second in 2011, and Finland was not consistently the smallest. Several chart features are omitted, and the final sentence about 2011 India is unfinished in its comparison. The response is also one word below the required 150 words; the eight words copied from the prompt are excluded from the count. Add a fuller overview and check rankings against the chart.
Coherence and Cohesion: Band 5.5
The response has a basic, useful structure: an introduction, an overview, and separate paragraphs for China and India. This helps the reader distinguish the two destinations, and phrases such as “followed by” signal comparisons. However, progression is uneven. The overview’s statement about Belgium and Finland is not clearly tied to both years, while the final India paragraph moves from 2000 to 2011 without a clear transition or a complete comparison. Some links are also awkward, as in “Germany was the led exporter … followed.” Organise each destination paragraph consistently by year or by the largest changes, and use explicit transitions such as “By 2011” to make the comparisons easier to follow.
Lexical Resource: Band 5.5
You use some task-relevant vocabulary, including “percentage,” “exporter,” “delivered,” and “overtaking,” and the reader can generally understand the intended comparisons. However, the range is limited and several word-choice, collocation, and spelling errors reduce precision: “propotions,” “googd,” “led exporter,” “sama,” and “Kindom” are noticeable. “Delivered” is also an imprecise way to describe a country’s share of exports, and “most export” is not a natural phrase. Use accurate terms consistently, such as “accounted for,” “share,” and “largest proportion,” and proofread country names and key vocabulary. This would make the data description clearer and more appropriately formal.
Grammatical Range and Accuracy: Band 5.0
You attempt both simple statements and longer comparisons, for example, “Most of the googd to China were from Germany with 38% in 2000 and 48% in 2011.” However, the range of sentence structures is limited, and frequent errors affect accuracy. The opening has subject–verb disagreement (“The pie charts gives”), and the overview contains a faulty construction (“Germany was the led exporter … followed”). Other problems include missing articles or prepositions in “In United Kindom dominated exports” and the incomplete comparison “Austria and Finland supplied 2% of of goods respectively.” These errors sometimes make relationships between figures unclear. Practise complete sentence patterns for describing shares and rankings, and check agreement, articles, and sentence completeness.
See this exact question answered at other band scores. The same prompt compared across bands.
Browse more IELTS Writing model answers or get your own writing scored by the same AI examiner.