Band 6.0 IELTS Writing Task 1 Model Answer
Overall Band Score: 6.0 · IELTS Momentum Workout · 2026-11-06
IELTS Writing Task 1 question
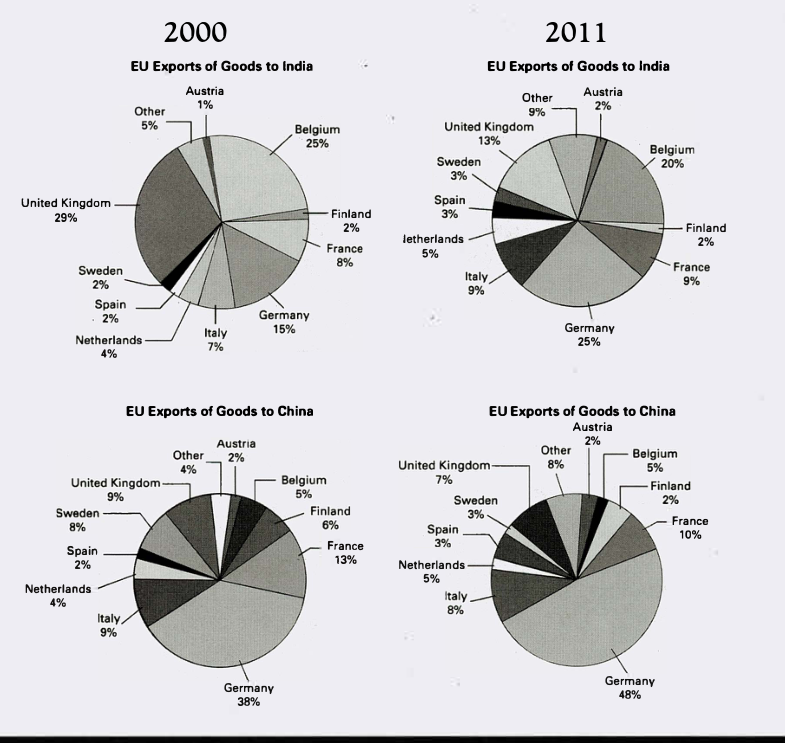
The pie charts below show exports from various EU countries to India and China in 2000 and 2011.
Summarise the information by selecting and reporting the main features, and make comparisons where relevant.
EU Exports of Goods to India and China in 2000 and 2011
Student answer (Band 6.0)
The given pie charts illustrates exports from countries like Germany,Britain and Sweden to India and China from 2000 to 2011.
Overall,Germany is noted to outshine the other countries as it is the biggest exporter in both 2000 and 2011.In 2000,Belgium exports the most to India at 25percent .Austria,Finland and Spain are generally exporting the least.
In India the year 2000,Belgium was rated at around 25% making it significantly the largest impoter.It was closely followed by Germany at 15%.Austria is notably low at 1%.In 2011,Germany increases significantly to 25% outshining Belgium which follows closely at 20%.The lowest in this case are Finland and Austra at 2% however Austria has increased by double since 2000.
In China 2000 Germany was the best at 38% followed by France at 13%.The lowest were Austria and Spain at 2%.In 2011 Germany shows a dramatic increase to 48% this is an improvement by 10%from about a decade ago.Spain increases from 2-3% while Austria stagnates at 2%.
AI examiner evaluation
| Criterion | Band |
|---|---|
| Task Achievement / Task Response | 6.0 |
| Coherence and Cohesion | 6.5 |
| Lexical Resource | 6.0 |
| Grammatical Range and Accuracy | 5.5 |
| Overall | 6.0 |
Task Achievement / Task Response: Band 6.0
You identify the main pattern that Germany is a leading exporter, and you support this with accurate figures for both destinations, including its rise from 38% to 48% in China and from 15% to 25% in India. You also compare the leading Indian exporters in 2000 and 2011 and mention some of the smallest shares. However, the overview is incomplete: Germany is not the largest exporter to India in 2000, where the UK leads at 29%, and the response does not report the UK’s substantial fall to 13% by 2011. Several other changes, such as France’s and Sweden’s shares in China, are also omitted. Develop the overview around the contrasting patterns in India and China, and select a few more key changes to make the summary more balanced.
Coherence and Cohesion: Band 6.5
The response has a clear overall arrangement: an introduction, an overview, and separate paragraphs for India and China. This makes the destination-based comparisons easy to follow, and phrases such as “In 2011” and “In China 2000” help signal changes in time and topic. To make the progression more fluent, use consistent, complete transitions and avoid abrupt joins. For example, “Germany shows a dramatic increase to 48% this is an improvement” combines two ideas without suitable punctuation or a linking word. The overview could also guide the reader more clearly by contrasting the changing distribution of exports to India with Germany’s dominance in China. These improvements would build on the coherent structure already present and make cohesion less dependent on basic time markers.
Lexical Resource: Band 6.0
You use an adequate range of vocabulary for describing proportions and change, including “significantly,” “followed by,” “dramatic increase,” and “stagnates.” These choices help communicate the main comparisons. Some wording is imprecise or too informal for a data report: “outshine” and “best” suggest evaluation rather than share, while “rated at” is not a natural way to describe an export percentage. There are also spelling errors, including “impoter” and “Austra,” and “improvement” does not accurately describe a rise in share. Choose neutral reporting language such as “accounted for,” “represented,” and “increased,” and check country names and spelling carefully. More precise collocations would make the comparisons clearer without requiring a much wider vocabulary.
Grammatical Range and Accuracy: Band 5.5
You attempt both simple and more complex sentences, and the meaning is generally understandable. There are some errors in sentence structure, agreement, tense, and punctuation. For example, “The given pie charts illustrates” has a plural subject with a singular verb, while “In India the year 2000” is not a complete, well-formed opening phrase. In “Germany shows a dramatic increase to 48% this is an improvement,” two independent clauses run together. Commas are also missing after introductory phrases, and spacing around punctuation is inconsistent. Use a reliable pattern such as “In India in 2000, Belgium accounted for…” and separate related clauses with a full stop or an appropriate conjunction. This would improve accuracy while allowing you to retain varied sentence forms.
See this exact question answered at other band scores. The same prompt compared across bands.
Browse more IELTS Writing model answers or get your own writing scored by the same AI examiner.