Band 6.0 IELTS Writing Task 1 Model Answer
Overall Band Score: 6.0 · IELTS Momentum Workout · 2026-11-06
IELTS Writing Task 1 question
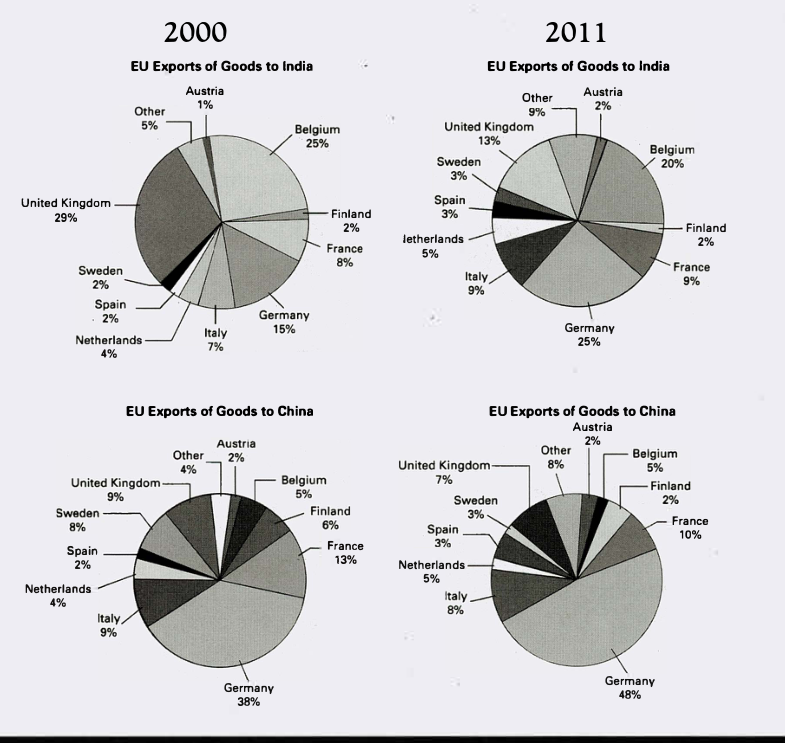
The pie charts below show exports from various EU countries to India and China in 2000 and 2011.
Summarise the information by selecting and reporting the main features, and make comparisons where relevant.
EU Exports of Goods to India and China in 2000 and 2011
Student answer (Band 6.0)
The pie charts illustrate the proportion of exports from various Europe union countries to India and China in years 2000 and 2011.
Overall, Germany remained the top exporter to both Asian countries. It remained on top of chart for China, but there is variation between UK and Germany exports percentage for India.
Regarding India United Kingdom remained the top exporter account for 29% in 2000, which significantly reduce to 13% in 2011. Meanwhile, Belgium is on the second position exports about 25%, followed by Germany 15% in 2000. However, Germany expands it market about 10% in 2011 overtaking the UK to become the leading exporter for India at 25%. Other smaller shares held by Italy and France account for 8%, alongside minor contributors varying between 1 to 5 percent.
For China, Germany maintained its market stronghold in China market. In 2000 Germany exports accounted for 38% of its total, which further increase to 48% in 2011. France contribute to 13% in 2000 and it reduce to 10% in 2011. Other countries maintained its exports below 10%.
AI examiner evaluation
| Criterion | Band |
|---|---|
| Task Achievement / Task Response | 6.5 |
| Coherence and Cohesion | 6.5 |
| Lexical Resource | 6.0 |
| Grammatical Range and Accuracy | 5.5 |
| Overall | 6.0 |
Task Achievement / Task Response: Band 6.5
You identify the main pattern that Germany was the leading exporter to China in both years and became the largest exporter to India by 2011. The comparison between the UK’s fall from 29% to 13% and Germany’s rise from 15% to 25% is also relevant and accurate. This gives the response a clear overview and supports the key changes. However, some details are imprecise: Belgium was second in India in 2000 at 25%, but the phrase “about 25%” is less exact, and the statement that Italy and France account for 8% groups figures from different countries and years unclearly. The China section gives only a few figures, while several notable changes, such as Finland’s fall and Germany’s growing share, could be compared more fully. More precise selection and development would strengthen coverage.
Coherence and Cohesion: Band 6.5
The response has a clear overall arrangement: an introduction, an overview, and separate paragraphs for India and China. This makes the two destinations easy to follow, and transitions such as “Meanwhile,” “However,” and “For China” help signal comparisons and shifts. The progression is generally logical, though some links between details are unclear. For example, “Other smaller shares held by Italy and France account for 8%” does not make clear which year or which country the 8% refers to, interrupting the comparison. The China paragraph also moves from Germany to France and then to a broad statement without developing the smaller shares. Use clearer references to the year and destination, and group figures by the main changes, to make cohesion less dependent on basic transition words.
Lexical Resource: Band 6.0
You use a suitable range of chart-related vocabulary, including “proportion,” “leading exporter,” “accounted for,” “overtaking,” and “contributors.” These choices communicate the main trends and show some willingness to use more precise language than simple repetition of “exports.” However, several collocations and word forms are inaccurate or awkward, such as “Europe union countries,” “remained on top of chart,” “Germany expands it market,” and “maintained its market stronghold in China market.” These do not usually prevent understanding, but they reduce naturalness and precision. Aim for standard expressions such as “EU member states,” “the largest share,” and “Germany’s share increased.” Also avoid vague phrases such as “other countries” when a more specific summary of the smaller contributors is possible.
Grammatical Range and Accuracy: Band 5.5
You attempt both simple and more complex sentence forms, including the contrast in “However, Germany … overtaking the UK” and the relative clause in “which significantly reduce to 13%.” The overall meaning is usually understandable, but some grammatical errors recur. Tense and agreement are inconsistent: “which significantly reduce” should be “which fell,” while “France contribute” and “it reduce” need past-tense forms. Articles and sentence structure also need attention in phrases such as “on the second position” and “remained on top of chart.” The sentence beginning “Meanwhile, Belgium is on the second position exports…” is particularly difficult to parse. Check verb forms and build comparisons in complete, clearly structured sentences; this would improve accuracy while preserving your attempts at complex grammar.
See this exact question answered at other band scores. The same prompt compared across bands.
Browse more IELTS Writing model answers or get your own writing scored by the same AI examiner.