Band 5.5 IELTS Writing Task 1 Model Answer
Overall Band Score: 5.5 · IELTS Momentum Workout · 2026-11-07
IELTS Writing Task 1 question
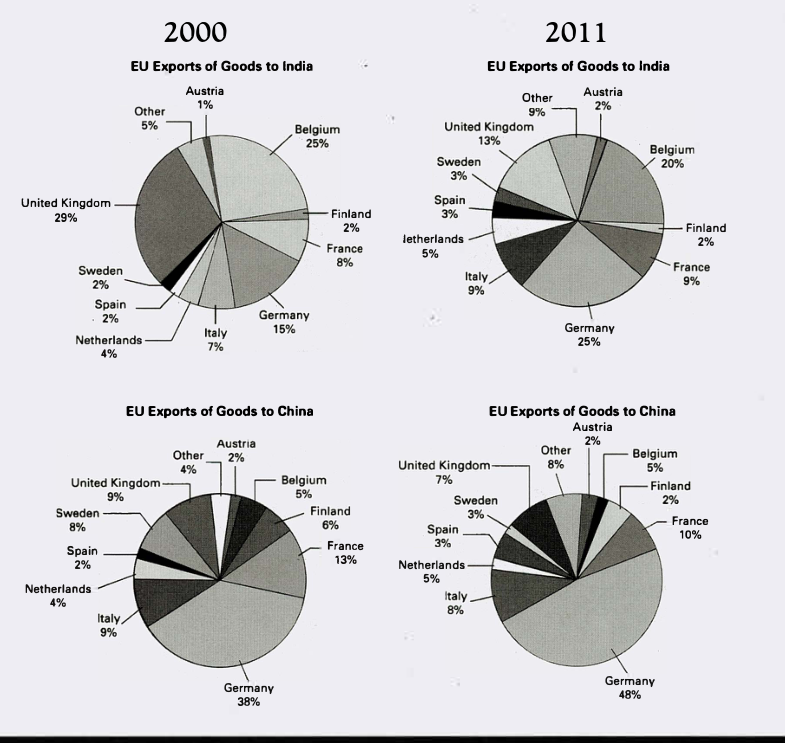
The pie charts below show exports from various EU countries to India and China in 2000 and 2011.
Summarise the information by selecting and reporting the main features, and make comparisons where relevant.
EU Exports of Goods to India and China in 2000 and 2011
Student answer (Band 5.5)
The pie charts give information about exports from various EU countries to India and China in 2000 and 2011.
Overall, In 2000, the United kigdom was the largest exporter of goods to india at 29%, while Germany took the lead in 2011 at 25%. For China, Germany was the dominant exporter in both years, rising from 38% to 48%, whereas Austria remained the lowest at 2% in both years.
In 2000, the United Kingdom was the big exporter of goods to india at 29%, Belgium, Germany, France, Italy, other, Netherlands at 25%, 15%, 8%, 7%, 5%, 4% respectively. Moreover, Finland, Sweden, Spain had same rate of exporters at 2%, while Austria was the lowest exporter at 1%to india in 2000. In contrast, in 2011, the exports of goods to india from United Kingdom, Belgium, decreased as compared to 2000 at 13% and 20% respectively, however, the proportion of exports of goods of other countries such as Germany, France, Italy, other, Netherlands, Spain, Sweden and Austria was increased at compared to 20000 at 25%, 9%, 5%, 3% 2% respectively.
On the other hand, For china, Germanwas the bighest exporter in both years, rising from 38% to 48%. All the other countries had little changes of exports of goods to china in both years , slightly decreased from 2000 to 2011.
AI examiner evaluation
| Criterion | Band |
|---|---|
| Task Achievement / Task Response | 5.5 |
| Coherence and Cohesion | 5.5 |
| Lexical Resource | 5.5 |
| Grammatical Range and Accuracy | 5.0 |
| Overall | 5.5 |
Task Achievement / Task Response: Band 5.5
You identify the main contrast: the UK led exports to India in 2000, Germany led in 2011, and Germany dominated exports to China in both years. Several figures are accurate, including the UK’s 29% share and Germany’s rise in China from 38% to 48%. However, the India account contains important inaccuracies and omissions: in 2011 Germany was 25%, not 25% alongside the listed increases that are mismatched; the figures given for the other countries are incomplete and incorrectly assigned. The claim that all other countries’ China exports decreased is also inaccurate: Austria and Belgium were unchanged, while the Netherlands, Spain and “Other” increased. The overview is relevant, but the report needs more reliable comparisons and a clearer account of the main changes.
Coherence and Cohesion: Band 5.5
The response has a recognisable structure, moving from an introduction and overview to India and then China. This gives the reader a basic route through the information. However, progression within the India paragraph is difficult to follow because many countries and percentages are packed into one sentence, and the 2011 figures are not clearly matched to their country names. Linking words such as “Moreover,” “In contrast,” and “On the other hand” are used, but some connections are awkward or do not clarify the comparison. The final China paragraph is very brief and general. Use separate, focused sentences for the largest shares, notable rises or falls, and smaller categories, and ensure each figure is placed immediately beside its country.
Lexical Resource: Band 5.5
You use relevant chart vocabulary, including “exports,” “proportion,” “dominant,” and “decreased,” so the topic is generally clear. However, the range is limited by repeated wording such as “exporter of goods” and “exports of goods,” and some choices are imprecise: “big exporter” is informal, while “had little changes of exports” does not express the comparison naturally. There are also noticeable spelling and word-form errors, including “kigdom,” “Germanwas,” and “bighest,” which reduce accuracy. Aim for concise, conventional language for describing shares and trends, and check spelling carefully. More precise terms such as “accounted for,” “share,” and “declined” would help make comparisons clearer.
Grammatical Range and Accuracy: Band 5.0
You attempt a mixture of simple statements and longer sentences with contrast, as in “For China, Germany was the dominant exporter in both years, rising from 38% to 48%.” However, complex sentences are often difficult to control, and frequent errors affect clarity. For example, “the proportion … was increased” uses an incorrect passive form, and “at compared to 20000” has an incomplete grammatical construction. The long India sentence beginning “In 2000” also lacks clear sentence boundaries between the list and the next point. Capitalisation and punctuation are inconsistent, including “In” after “Overall” and commas separating several clauses. Practise shorter, complete comparison sentences, with accurate past-tense verbs and punctuation, before combining ideas.
See this exact question answered at other band scores. The same prompt compared across bands.
Browse more IELTS Writing model answers or get your own writing scored by the same AI examiner.