Band 5.5 IELTS Writing Task 1 Model Answer
Overall Band Score: 5.5 · IELTS Momentum Workout · 2026-11-08
IELTS Writing Task 1 question
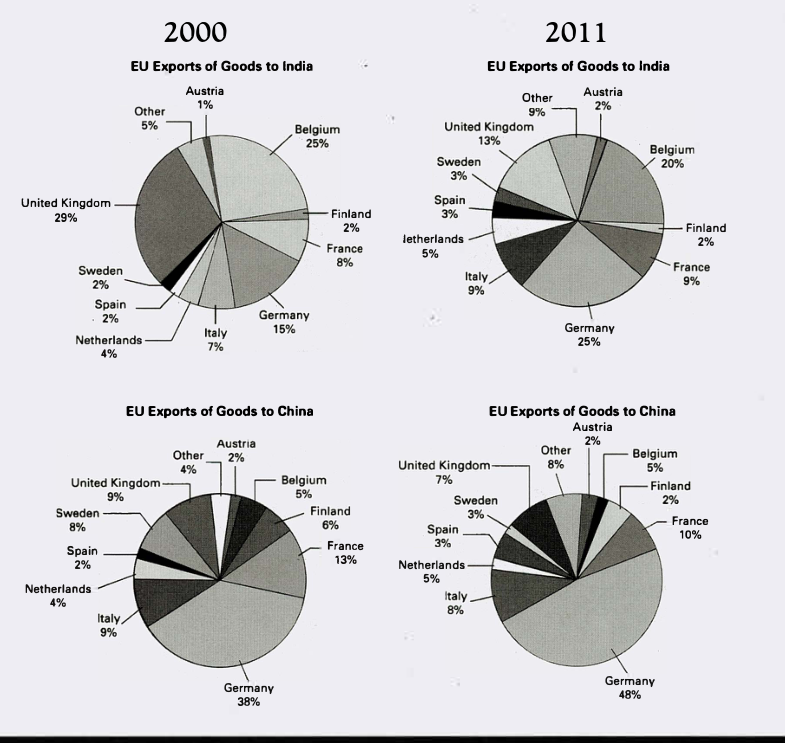
The pie charts below show exports from various EU countries to India and China in 2000 and 2011.
Summarise the information by selecting and reporting the main features, and make comparisons where relevant.
EU Exports of Goods to India and China in 2000 and 2011
Student answer (Band 5.5)
The following image demonstrate exports from various EU countries to india and china in 2000 and 2011.
Overall, the first two pie charts illustrates EU exports goods to india in 200 and 2011 in 2000 United Kingdom exports more goods than other countries. In 2011 Germany exports more goods as compared to other countries.
The last two pie charts shows EU exports to china. Germany had higest export of goods as compared to other countries in both years.
In 2000 UK had highest numbers of exports to india which is 29% second in this chart is Belgium which is 25% the lowest in this list is Sweden,Spain and Finland which had almost the same 2% only. In 2011 Germany take the positon on number one with 25% Belgium had a reduce of only 5% and UK come from 29% to 13% in 2011.
In both 2000 and 2011 the Germany had highest ratio of goods export to china whic is 38% in 2000 and it gain 10% by the year 2011. The lowest in this list is Spain and other EU countries.
AI examiner evaluation
| Criterion | Band |
|---|---|
| Task Achievement / Task Response | 6.0 |
| Coherence and Cohesion | 6.0 |
| Lexical Resource | 5.5 |
| Grammatical Range and Accuracy | 5.0 |
| Overall | 5.5 |
Task Achievement / Task Response: Band 6.0
You identify the main contrast accurately: the UK led exports to India in 2000, while Germany was largest in 2011, and Germany dominated exports to China in both years. The figures you give for these key points are correct, including Germany’s rise from 38% to 48% in China. However, the overview is brief and some comparisons are incomplete. For example, you do not report that Germany’s share of India exports rose from 15% to 25%, or that the UK’s share fell substantially. The claim that Spain and “other EU countries” were the lowest for China is also imprecise: Spain was lowest in 2000, while Austria, Finland and Spain shared the lowest figure in 2011. Select and compare a few more key changes clearly.
Coherence and Cohesion: Band 6.0
The response has a clear overall arrangement: an introduction, an overview, and separate paragraphs for India and China. This makes the main comparisons reasonably easy to follow, and phrases such as “In 2011” and “In both 2000 and 2011” help signal time and topic. However, some links between details are abrupt, particularly in the India paragraph, where several figures are placed in a long sequence without clear sentence boundaries. The overview also repeats the chart divisions rather than bringing the most important trends together. Use clearer transitions to connect changes across years, and make sure each paragraph develops a focused comparison rather than listing figures.
Lexical Resource: Band 5.5
You use relevant vocabulary for describing charts, including “exports,” “highest,” “lowest,” “reduce,” and “ratio,” so the topic is generally clear. However, some word choices and collocations are inaccurate or repetitive. “Germany take the position on number one” and “highest numbers of exports” are awkward ways to describe shares, while “gain 10%” does not clearly express a rise from 38% to 48%. There are also spelling errors such as “higest,” “positon,” and “whic.” Aim for precise chart language such as “accounted for,” “share,” “rose by,” and “fell to,” and check spelling carefully. This would make the comparisons more natural and exact.
Grammatical Range and Accuracy: Band 5.0
Your response includes both simple statements and some attempts to connect ideas, and the intended meaning is usually understandable. However, errors in verb forms, agreement, articles, and sentence boundaries occur across the response. For example, “The following image demonstrate” needs subject–verb agreement, and “the first two pie charts illustrates” has the same issue. “Germany take the positon” should use a past-tense verb, while “Belgium had a reduce” shows an incorrect grammatical form. Several sentences also run together, such as the comparison beginning “In 2000 UK had highest numbers…”. Practise accurate past-tense reporting and build shorter, correctly punctuated sentences before adding more complex structures.
See this exact question answered at other band scores. The same prompt compared across bands.
Browse more IELTS Writing model answers or get your own writing scored by the same AI examiner.