Band 5.0 IELTS Writing Task 1 Model Answer
Overall Band Score: 5.0 · IELTS Momentum Workout · 2026-11-05
IELTS Writing Task 1 question
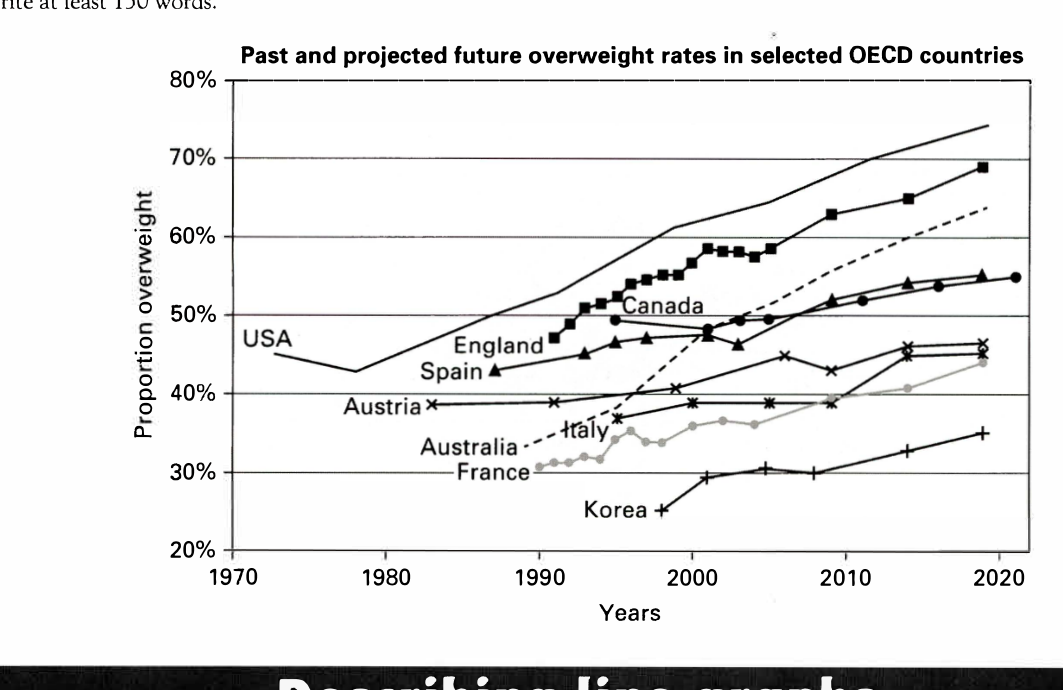
The line graph below shows past and current overweight rates, as well as a projected future overweight rate in nine selected countries.
Summarise the infonnation by selecting and reporting the main features, and make comparisons where relevant.
Past and projected future overweight rates in selected OECD countries
Student answer (Band 5.0)
The line graph illustrate the changes in the past and ongoing overweight rates in the particular OECD regions.
Overall, it express that highest proportion overweight is going towards the USA and the lowest rate is with the korea. In 1972, USA was 47% and after that it gotrough a break down upto 43% 1980 after that it grow gradually in 2020 it touched up to 75%. However, Korea did not showup any progress progress till 1998 but after that proportion overweight progressively increased.
Austria showed by its journey in 1982 with 39% and with the passage of time it increased gradually with few ups and down in 2020 it hits 45%. On the other hand, Canada and Itlay both started there growth 1998 with 49% and 38% after few hurdles it showed by with 54% and 54%.
In 1887 England and France shows their proportion with that england reaches the second highest proposinate country with 69% although, france got 43%. Austria, Spain and Australia showed their part in between 1980 to 1990 and few duration they grew.
AI examiner evaluation
| Criterion | Band |
|---|---|
| Task Achievement / Task Response | 4.5 |
| Coherence and Cohesion | 4.5 |
| Lexical Resource | 5.0 |
| Grammatical Range and Accuracy | 5.0 |
| Overall | 5.0 |
Task Achievement / Task Response: Band 4.5
You identify the broad pattern that the USA has the highest rate and Korea the lowest, and you attempt to compare several countries. However, the overview is not sufficiently accurate or clear: Korea’s rate did rise from about 25% in 1998, rather than showing no progress until then, and the graph does not establish that the USA was highest throughout the whole period. Several details are misreported, including Austria’s starting year and final rate, and the claim that Canada and Italy both reached 54%. The reference to “1887” is also inconsistent with the chart’s dates. To make the summary more effective, select the clearest overall trends and support them with accurate comparisons, such as the USA rising to about 74% and Korea remaining lowest at roughly 35% in 2019.
Coherence and Cohesion: Band 4.5
The response has an opening, an overview-like paragraph and further country comparisons, so there is some attempt to organise the information. However, the progression is difficult to follow because countries and dates are introduced without a consistent grouping or clear sequence. For example, the paragraph moves from Austria to Canada and Italy, then to England and France, before mentioning three more countries. Linking phrases such as “However” and “On the other hand” are used, but the relationships they signal are not always clear. Some sentences also combine several figures and trends, making comparisons hard to track. Grouping countries by high, middle and low rates, and using one focused paragraph for each group, would create a clearer progression.
Lexical Resource: Band 5.0
You use some relevant vocabulary for describing trends, including “proportion,” “increased gradually” and “ups and down,” and you attempt to vary your wording. However, several choices are inaccurate or unnatural, which sometimes makes the intended meaning difficult to understand. Phrases such as “gotrough a break down,” “showed by its journey,” and “showed by with” do not express the trends clearly. There are also spelling errors in country names and key terms, including “korea,” “Itlay” and “proposinate.” Aim for precise, conventional chart language and check spelling carefully. Terms such as “fell,” “rose,” “fluctuated” and “reached” would help you describe changes more clearly and economically.
Grammatical Range and Accuracy: Band 5.0
You attempt both simple and longer sentences, including a contrast introduced by “However” and a sentence beginning “On the other hand.” Nevertheless, errors in sentence structure, verb forms and agreement occur frequently, and some sentences are difficult to interpret. For example, “The line graph illustrate” needs subject–verb agreement, while “it express” and “England and France shows” also have incorrect verb forms. Several clauses lack necessary grammatical connections or punctuation, as in “in 2020 it touched up to 75%.” Articles, prepositions and tense choices are also inconsistent. Practise building clear sentences with a subject and verb for each trend, and use past tense for historical data and future forms only for projections.
See this exact question answered at other band scores. The same prompt compared across bands.
Browse more IELTS Writing model answers or get your own writing scored by the same AI examiner.