Band 5.0 IELTS Writing Task 1 Model Answer
Overall Band Score: 5.0 · IELTS Momentum Workout · 2026-11-06
IELTS Writing Task 1 question
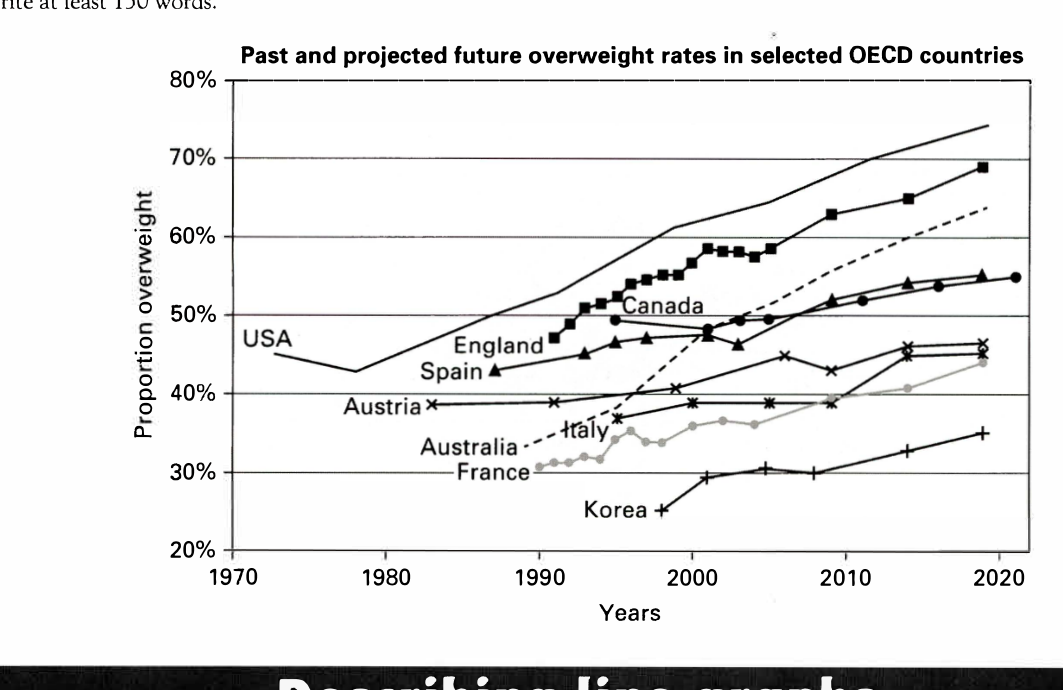
The line graph below shows past and current overweight rates, as well as a projected future overweight rate in nine selected countries.
Summarise the infonnation by selecting and reporting the main features, and make comparisons where relevant.
Past and projected future overweight rates in selected OECD countries
Student answer (Band 5.0)
The line graph illustrates the past and current overweight rates, as well as a projected future overweight rate in nine selected countries. The graph is telling about the rates in selected OECD countries.
On vertical side, there is 20 to 80 percent given proportion overweight and on the horizontal side, the years are mentioned from 1970 to 2020. For example,there is an increase in the year 2020 among all the given countries. The USA had a decrease in 1980 and after that there is surge increase in the year 1990 to 2020. The overweight rate in England started in the year 1990 and it goes up till 2020. The Canada had mutual increase and decrease that started in the middle of 1990 and 2020 whereas the spain started in the middle of 1980 and 1990 which is lowest among the countries vice versa.
The USA has highest percentage which is 80 whereas the Korea has lowest ratio which is less then 40 in the year 2020. In 1970, only USA had their ratio starting between 40 to 50 percent. All of these countries are fluctuating with eachother at some point.
AI examiner evaluation
| Criterion | Band |
|---|---|
| Task Achievement / Task Response | 4.5 |
| Coherence and Cohesion | 4.5 |
| Lexical Resource | 5.0 |
| Grammatical Range and Accuracy | 5.0 |
| Overall | 5.0 |
Task Achievement / Task Response: Band 4.5
You identify the graph’s subject and mention several relevant countries and broad trends, including the USA’s early decline followed by growth and Korea’s comparatively low rate. However, the account is only partial and key details are inaccurate: the USA is described as reaching 80%, although its projected figure is about 74%, and the graph shows Korea at roughly 35%, not simply “less than 40.” The claim that all countries increase in 2020 is also too broad, and the comparison that Spain is “lowest among the countries” is unclear and unsupported. There is no clear overview of the main pattern across the nine countries. Select the most important contrasts, report them accurately, and distinguish the highest and lowest projected rates.
Coherence and Cohesion: Band 4.5
The response has a basic sequence: it introduces the graph, describes the axes, and then comments on selected countries. This gives the reader some sense of the topic, but the ideas do not develop in a clear overall progression. The axis description takes space without helping to organise the comparisons, while the country details are grouped inconsistently and the final sentence, “All of these countries are fluctuating with eachother at some point,” does not provide a clear conclusion. Linking expressions such as “whereas” and “after that” are attempted, but relationships between ideas are sometimes unclear. Organise the report around an overview and meaningful groups, such as the highest versus lowest rates, then use clear comparisons within each group.
Lexical Resource: Band 5.0
You use some relevant vocabulary for describing a graph, including “increase,” “decrease,” “percentage,” and “fluctuating,” so the topic is generally understandable. However, the range is limited and several choices are imprecise or unnatural, such as “surge increase,” “mutual increase and decrease,” and “lowest ratio.” Repetition of “rate” and “increase” also limits the precision of the description. Some wording makes the intended comparison difficult to follow, particularly “which is lowest among the countries vice versa.” Aim for standard graph language and more exact terms for movement and ranking. For example, describe a rate as rising, remaining stable, or fluctuating, and use “highest” or “lowest” only when the comparison is clear.
Grammatical Range and Accuracy: Band 5.0
You produce several complete simple sentences and attempt longer structures, for example, “The USA had a decrease in 1980 and after that there is surge increase…” However, the range is limited, and errors recur in sentence construction, tense, agreement, articles, and punctuation. Examples include “The graph is telling about,” “The Canada had,” and “the spain started”; the sentence beginning “The USA had…” also shifts from past tense to present (“there is”). Commas are missing after introductory phrases, as in “For example,there,” and some clauses are joined in ways that obscure their relationship. Practise consistent past-tense reporting for historical data and use controlled comparative sentence patterns, checking articles, capitalisation, and punctuation.
See this exact question answered at other band scores. The same prompt compared across bands.
Browse more IELTS Writing model answers or get your own writing scored by the same AI examiner.