Band 5.0 IELTS Writing Task 1 Model Answer
Overall Band Score: 5.0 · IELTS Momentum Workout · 2026-11-06
IELTS Writing Task 1 question
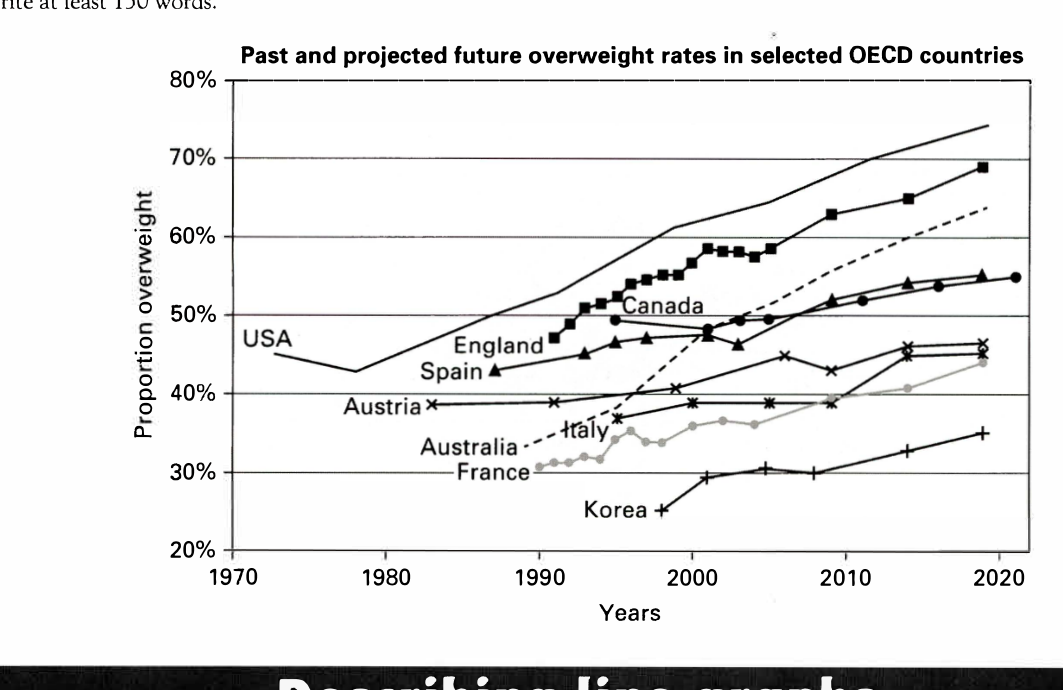
The line graph below shows past and current overweight rates, as well as a projected future overweight rate in nine selected countries.
Summarise the infonnation by selecting and reporting the main features, and make comparisons where relevant.
Past and projected future overweight rates in selected OECD countries
Student answer (Band 5.0)
The line graph beneath demonstrate past and current highweight rates, as well as a projected future obesity rate in nine given countries.
Overall, the graph illustarte that USA is the oldest country in this list and aslo with the highest overweight ratio as compared to the other countries. Korea is the latest country with least numbers of overweights.
We can observe from the line graph that USA had the most numbers of overweight in 1970 which is almost 45%. From 1970 to 1980 you can see a steady decresae in this numbers but from 1980 the line had skyrocketed by the 2020 which is around 75%. England is on second number in 1990 the ratio of England is 46% and than this ratio baloomed directly to 70% by the year 2020.
Canada appear in 1995 in this race firstly they had around 50% ratio but after that in 2000 this numer reduced gradually to 48% after that it increased slowly to 55% by the year 2020. Korea had least numbers of overweights in this graph as compared to the others from around 2000 to 2020 it gains only 10% rates which is very rear.
AI examiner evaluation
| Criterion | Band |
|---|---|
| Task Achievement / Task Response | 4.5 |
| Coherence and Cohesion | 5.5 |
| Lexical Resource | 5.0 |
| Grammatical Range and Accuracy | 5.0 |
| Overall | 5.0 |
Task Achievement / Task Response: Band 4.5
You identify the USA as having the highest rate and Korea the lowest, and you include some relevant figures for the USA, England, Canada and Korea. However, the overview is partly inaccurate: calling the USA the “oldest country” and Korea the “latest country” does not describe the data, and the graph shows rates rather than numbers of people. Coverage is also limited to four countries, with no account of the overall pattern across the other five. Some details are misread: England is about 47% in 1991, not 46% in 1990, and Canada rises overall from about 50% in 1994 to 55% in 2020 rather than falling gradually after 2000. Select the main trends accurately and compare more of the countries.
Coherence and Cohesion: Band 5.5
The response has a basic, recognisable structure: an introduction, an overview and two paragraphs of details. The country-based grouping helps readers follow the figures, and time markers such as “from 1970 to 1980” and “by the year 2020” provide some sequence. However, the progression is limited because the report moves from the USA and England to Canada and Korea without a clear organising principle or coverage of the remaining countries. Linking is also repetitive, especially the repeated use of “after that,” and some references such as “this numbers” are unclear. Grouping countries by high, middle and low rates, then using more precise comparisons, would make the information easier to follow.
Lexical Resource: Band 5.0
You use some relevant vocabulary for describing trends, including “steady decrease,” “increased slowly” and “ratio.” However, the range is limited and several word choices or collocations are inaccurate enough to make parts of the report unclear. “Oldest country” and “latest country” do not express highest and lowest rates, while “numbers of overweights” is not a natural way to describe the chart’s proportions. There are also noticeable spelling errors, including “illustarte,” “decresae,” “baloomed” and “rear.” Use standard chart language consistently, such as “proportion,” “rate,” “rose,” “fell” and “remained the lowest,” and check spelling before submitting.
Grammatical Range and Accuracy: Band 5.0
You attempt both simple and longer sentences, and the time clauses in “From 1970 to 1980…” show an effort to describe change across periods. However, the range is limited, and frequent errors in sentence construction, agreement and articles affect clarity. For example, “The line graph … demonstrate” needs a singular verb, while “this numbers” and “Canada appear” have agreement problems. The sentence beginning “From 1970 to 1980” is a fragment, and several clauses are joined with commas rather than correctly punctuated. Practise building complete sentences with accurate subject–verb agreement, and use full stops or conjunctions to separate related trends.
See this exact question answered at other band scores. The same prompt compared across bands.
Browse more IELTS Writing model answers or get your own writing scored by the same AI examiner.