Band 4.5 IELTS Writing Task 1 Model Answer
Overall Band Score: 4.5 · IELTS Momentum Workout · 2026-11-08
IELTS Writing Task 1 question
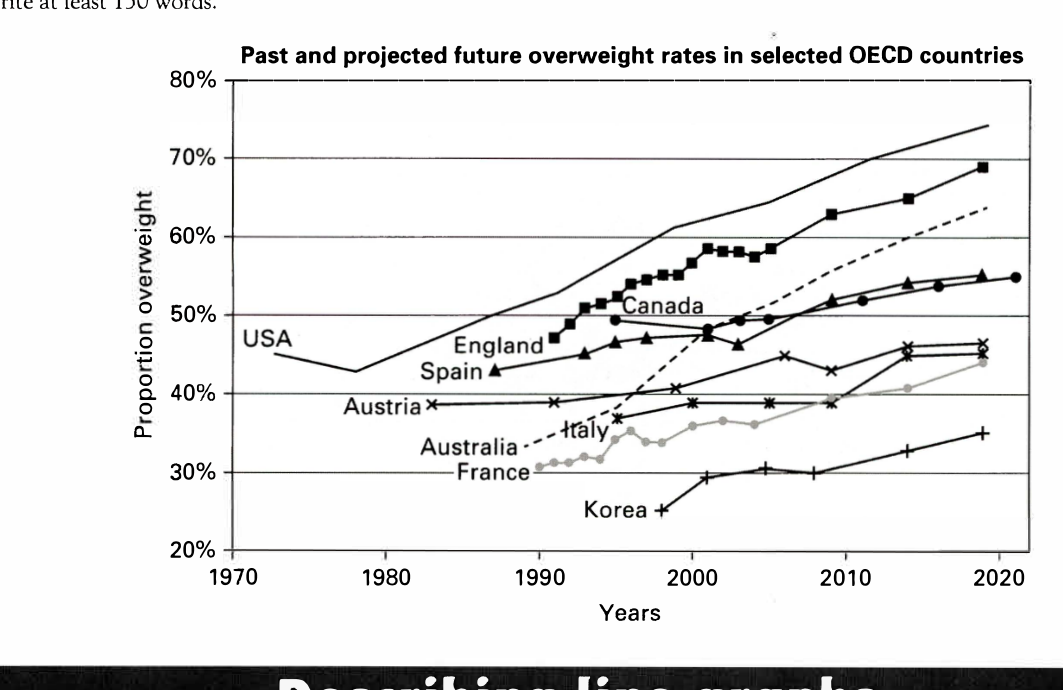
The line graph below shows past and current overweight rates, as well as a projected future overweight rate in nine selected countries.
Summarise the infonnation by selecting and reporting the main features, and make comparisons where relevant.
Past and projected future overweight rates in selected OECD countries
Student answer (Band 4.5)
The given line graph below illustrates past and current overweight rates, as well as a projected future overweight rate in nine selected countries. X-axis shows years, Y-axis shows proportion overweight and countries are within the graph.
In 1970,USA is the only country seen in graph showing its past growth of about 45% and it enhanced to approximately 72% in 2020. Other eight countries started their production nearly between 1980 and 1995. England went from 45% to 70% within 50 years. Canada has shown less progress of anout 5%. Spain showed increase of 10%. Austrailia expanded overweight proportion with large range in 2000 and reached 55% in 2000. France met with up and down fluctuation and achieved 42% in 2020. Austria and Italy remained nearly close moving from about 38% to 44%. In nearly 2000, he poportion overweight of Korea is 25%, it reached to about 35% in 2020.
AI examiner evaluation
| Criterion | Band |
|---|---|
| Task Achievement / Task Response | 3.5 |
| Coherence and Cohesion | 4.5 |
| Lexical Resource | 5.5 |
| Grammatical Range and Accuracy | 5.0 |
| Overall | 4.5 |
Task Achievement / Task Response: Band 3.5
You identify the graph’s subject and report several country trends, including the USA’s high rate and Korea’s lower figures. However, the response is under the required 150 words, which limits how fully you can summarise the main features. Some details are inaccurate or unclear: Australia is said to reach 55% in 2000, although it is about 46% then and reaches roughly 64% by 2020; the USA’s final figure is closer to 74%, not 72%. The overview is also missing: state clearly that rates generally rise, with the USA highest and Korea lowest near the end. Develop comparisons using accurate start and end points, rather than listing brief country-by-country claims.
Coherence and Cohesion: Band 4.5
The response follows a broadly chronological and country-based order, so the reader can identify which nations are being discussed. However, it is presented as one paragraph and lacks a clear overview separating the main pattern from supporting details. Connections between points are limited, and the sequence sometimes feels like a list: “Spain showed increase of 10%” is followed by Australia, France, Austria and Italy without a clear grouping or comparison. Use an overview first, then organise details into groups, such as the highest-rising countries and those with lower rates. Clearer sentence boundaries and linking phrases would make the progression easier to follow.
Lexical Resource: Band 5.5
You use some relevant graph vocabulary, including “proportion overweight,” “fluctuation,” and “approximately,” and the country names and percentages make the topic clear. However, several word choices or collocations are inaccurate or unnatural, such as “past growth,” “started their production,” “less progress,” and “expanded overweight proportion.” There are also spelling errors, including “anout,” “Austrailia,” and “poportion.” These choices sometimes make the intended trend difficult to interpret. Prefer precise reporting verbs such as “rose,” “increased,” or “remained stable,” and use “rate” or “proportion” consistently. Proofreading country names and common task vocabulary would improve clarity.
Grammatical Range and Accuracy: Band 5.0
You attempt both simple statements and longer sentences, and most of the country comparisons remain understandable. However, grammatical control is uneven, particularly in sentence construction, articles, and punctuation. For example, “In 1970,USA is the only country seen in graph” has a missing space after the comma and awkward article use; “England went from 45% to 70% within 50 years” also uses a time span that is not clearly supported by the data. The final sentence, “In nearly 2000, he poportion overweight of Korea is 25%,” has a faulty structure that obscures the meaning. Practise accurate past-tense reporting and build sentences around a clear subject and verb.
See this exact question answered at other band scores. The same prompt compared across bands.
Browse more IELTS Writing model answers or get your own writing scored by the same AI examiner.