Band 5.5 IELTS Writing Task 1 Model Answer
Overall Band Score: 5.5 · IELTS Momentum Workout · 2026-11-08
IELTS Writing Task 1 question
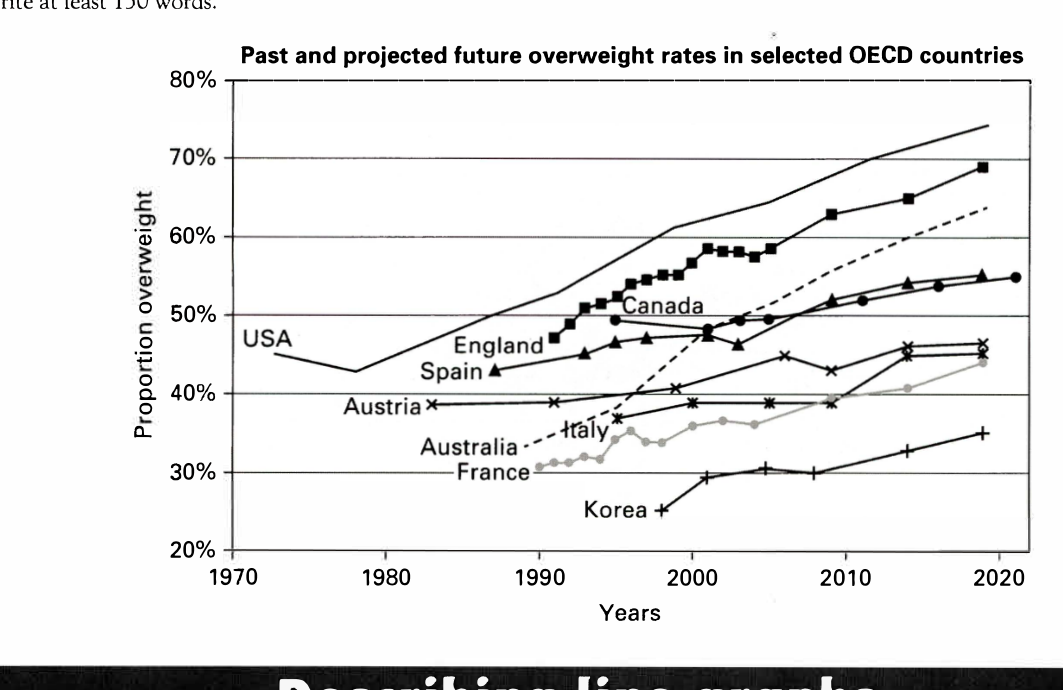
The line graph below shows past and current overweight rates, as well as a projected future overweight rate in nine selected countries.
Summarise the infonnation by selecting and reporting the main features, and make comparisons where relevant.
Past and projected future overweight rates in selected OECD countries
Student answer (Band 5.5)
The given graph illustrates the past and current overweight rates in nine different counteries.In USA the overweight propotion was slightly decreased in 1980 to 45 percent.But it is continuously increased from 45 to 75 percent till 2020.The overweight rate in england is also increased gradually.It will reach to 70 percent in 2020.Canada is showing little stablity.Its ratio is increased from 50 to 55 percent only, in overall period.Spain is showing slow progres.Its obesity rate is increased from 45 percent to 55 percent till 2020.The obesity rate in Auastri slightly increased.It reached to 40 percent till 2000.Then it reached to 45 percent over the next 10 years same like as Italy.Australia rised in obesity in very high level.It increased from almost 30 percent to more than 60 percent from 1990 to 2020.Korea and France also showed significant increase in overweight propotion (Korea 35%,France 45%).
The overall chart represents that overweight proportion is increasing with the passage of time.But USA's and Australia's obesity rate is increasing very highly.On contrary, Austria and Italy represents little rise.
AI examiner evaluation
| Criterion | Band |
|---|---|
| Task Achievement / Task Response | 6.0 |
| Coherence and Cohesion | 5.5 |
| Lexical Resource | 5.5 |
| Grammatical Range and Accuracy | 5.0 |
| Overall | 5.5 |
Task Achievement / Task Response: Band 6.0
You identify the main overall pattern—that overweight rates rise—and make relevant comparisons, including the USA’s and Australia’s high levels and the smaller increases in Austria and Italy. Several reported figures are broadly consistent with the chart: for example, Canada ends at about 55%, Spain at 55%, and Korea at 35%. However, some details are inaccurate or unclear. The USA begins at about 45%, dips to roughly 43% in 1980, and then rises; it does not decrease to 45% in 1980. Austria is around 39% in 1983 and 46–47% by 2019, rather than reaching 40% by 2000 and 45% over the next decade. The overview is relevant, but a clearer comparison of the highest and lowest rates would make the key features more complete.
Coherence and Cohesion: Band 5.5
The response follows a generally understandable sequence, moving through several countries before giving an overall summary. This gives the reader a basic sense of the chart’s trends, and phrases such as “But” and “On contrary” attempt to signal contrast. However, the information is presented as one long paragraph, and the country-by-country listing does not establish a clear hierarchy between the main overview and supporting details. Some links are also unclear: “Then it reached to 45 percent over the next 10 years same like as Italy” makes the comparison difficult to follow. Use separate paragraphs for the overview and grouped country comparisons, and connect related trends explicitly—for example, compare the highest-rate countries together and the lower-rate countries together.
Lexical Resource: Band 5.5
You use relevant chart vocabulary, including “overweight rates,” “proportion,” “increased,” and “stability,” and the country names and percentages generally make your meaning understandable. There is some repetition of “increased” and “rate,” however, and several word-choice or spelling problems reduce precision: “counteries,” “propotion,” “stablity,” and “Auastri” are misspelled, while “progress” is not a natural description of a rising rate. “Obesity rate” is also less consistent than the task’s term, “overweight rate.” Build a more varied but accurate set of trend expressions, such as “rose steadily,” “remained relatively stable,” and “climbed sharply,” and check spelling carefully.
Grammatical Range and Accuracy: Band 5.0
You communicate the main trends using mostly simple sentences, with some attempts to combine ideas, such as “But it is continuously increased from 45 to 75 percent till 2020.” However, verb forms and tense control are often inaccurate. For example, “it is continuously increased” should be “it increased steadily,” and “Australia rised” should be “Australia rose.” The sentence about Austria and Italy also lacks clear grammatical connections, while “It reached to 40 percent” uses an unnecessary preposition after “reached.” Sentence boundaries and spacing need attention, particularly where one sentence runs directly into the next. Practise past-tense reporting for historical data and use a few controlled complex sentences to compare countries; this would improve accuracy as well as range.
See this exact question answered at other band scores. The same prompt compared across bands.
Browse more IELTS Writing model answers or get your own writing scored by the same AI examiner.