Band 5.0 IELTS Writing Task 1 Model Answer
Overall Band Score: 5.0 · IELTS Momentum Workout · 2026-11-10
IELTS Writing Task 1 question
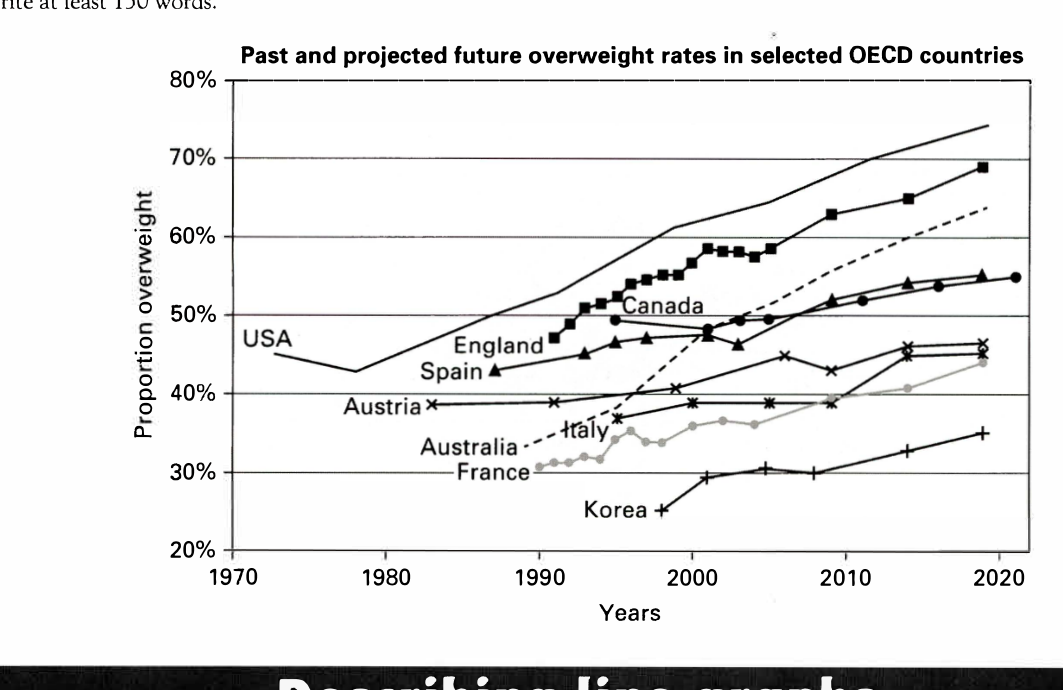
The line graph below shows past and current overweight rates, as well as a projected future overweight rate in nine selected countries.
Summarise the infonnation by selecting and reporting the main features, and make comparisons where relevant.
Past and projected future overweight rates in selected OECD countries
Student answer (Band 5.0)
The line chart illustrates the percentage of past and projected future overweight rates in the USA, England, Canada, Spain, Austria, Italy, Australia, France, and Korea. Starting from 1970 to 2010 and projected to 2020.
Overall, in 1970 only America was in the list of overweight, and most of the countries started their journey after 1980. Moreover, in 2020 the USA will be in the top of the list.
In 1970, only the USA was in the overweight list, accounted for around 45%, after a decade the proportion slightly declined to 43% after that the percentage increased gradually and in 2020, it is projected grow over 70%. While England started its journey in 1990, started from nearly 50% and in 2020, it expected to be the second ob
AI examiner evaluation
| Criterion | Band |
|---|---|
| Task Achievement / Task Response | 4.0 |
| Coherence and Cohesion | 5.5 |
| Lexical Resource | 5.5 |
| Grammatical Range and Accuracy | 5.0 |
| Overall | 5.0 |
Task Achievement / Task Response: Band 4.0
The response identifies the chart’s subject and reports a few relevant figures, including the USA’s fall from about 45% to 43% and its subsequent rise to above 70%. However, it addresses the task only minimally: the overview is limited to the USA being highest in 2020, and the body ends partway through a sentence about England. Most of the other countries and their trends are not summarised, so the main features and comparisons are largely missing. The claim that most countries “started their journey after 1980” is also imprecise, since the graph shows different starting years and does not establish that they were overweight only from then. The response is 23 words below the required minimum. To improve, complete the report and compare several countries’ overall levels and changes.
Coherence and Cohesion: Band 5.5
There is a basic attempt to organise the response into an introduction, an overview and a body paragraph, and sequencing phrases such as “after a decade” and “after that” help show the USA’s timeline. However, progression is limited because the response stops during the England comparison (“the second ob”), leaving the final idea incomplete and the report without a developed ending. Some linking is repetitive, particularly the repeated use of “after,” while “Moreover” does not introduce a clearly separate overview feature. The opening sentence fragment beginning “Starting from 1970” is also disconnected from the first sentence. Use complete paragraphs with a clear overview followed by grouped comparisons, and ensure each linking phrase accurately signals the relationship between ideas.
Lexical Resource: Band 5.5
The response uses relevant basic terms such as “percentage,” “proportion,” “declined,” and “increased gradually,” so the chart’s general subject is understandable. However, vocabulary is repetitive and some expressions are unnatural or imprecise: countries do not “start their journey” in this context, and “in the top of the list” is not a natural way to describe the highest rate. “Overweight list” is also unclear, and the unfinished phrase “second ob” prevents the intended comparison from being communicated. Aim for precise chart language and varied trend vocabulary, such as “the rate began at,” “rose steadily,” and “ranked second.” Check collocations and complete each phrase so that word choice supports clear reporting.
Grammatical Range and Accuracy: Band 5.0
The response attempts some longer sentences and uses past and future forms, but grammatical control is inconsistent, and several errors make the meaning less clear. “Starting from 1970 to 2010 and projected to 2020” is a sentence fragment; “the USA was in the overweight list, accounted for around 45%” lacks a correctly formed clause; and “it is projected grow” is missing “to.” The phrase “in 2020, it expected to be” also needs an auxiliary verb, while “England started its journey in 1990, started from nearly 50%” repeats the verb structure awkwardly. Practise complete sentence patterns and consistent tense choices, especially when describing past data and projections. Proofread for missing verbs and infinitive markers.
See this exact question answered at other band scores. The same prompt compared across bands.
Browse more IELTS Writing model answers or get your own writing scored by the same AI examiner.