Band 4.5 IELTS Writing Task 1 Model Answer
Overall Band Score: 4.5 · IELTS Momentum Workout · 2026-11-10
IELTS Writing Task 1 question
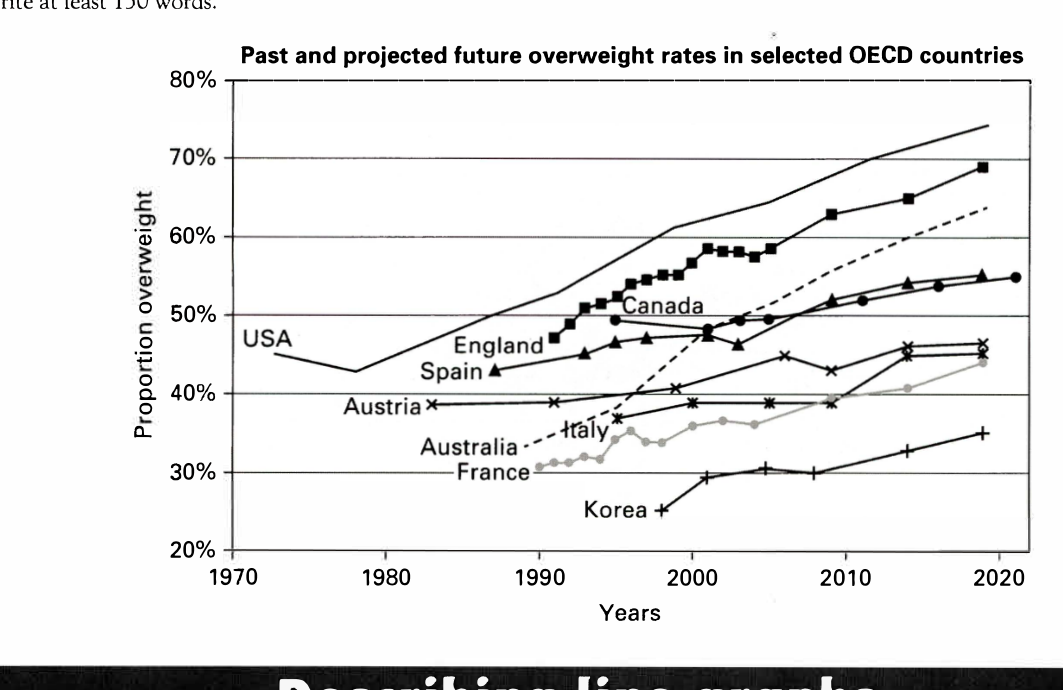
The line graph below shows past and current overweight rates, as well as a projected future overweight rate in nine selected countries.
Summarise the infonnation by selecting and reporting the main features, and make comparisons where relevant.
Past and projected future overweight rates in selected OECD countries
Student answer (Band 4.5)
The given chart illustrate us that the past and projected future overweight rates in selected OECD countries.We can see that in USA the rate is below 70% and the rate of Korea is below 30%.We can say that USA is the highest rate that the chart is showing and Korea is the lowest rate that the chart is illustrating. Theres more countries rate is belonging that the chart is showing thats are England, Canada, Austria, Italy, France, Spain.We can say that the lest of the countries are belonging in the middle rate of USA and Korea; as per they are the highest and lowest showing rate. projects that overweight is the countries are USA, England and Austria. And the countries that are not overweight are Korea, France, Italy. In my opinion these countries have to follow the rules of those countries which has reached overweight following years.At last we can say that, this chart is showing the rate of countries overweight.
AI examiner evaluation
| Criterion | Band |
|---|---|
| Task Achievement / Task Response | 4.0 |
| Coherence and Cohesion | 4.0 |
| Lexical Resource | 4.5 |
| Grammatical Range and Accuracy | 4.5 |
| Overall | 4.5 |
Task Achievement / Task Response: Band 4.0
You identify the USA as having the highest rate and Korea as the lowest, which are relevant overall comparisons. However, the response reports very little of the graph’s actual development: it gives no clear past-to-future trends or meaningful comparisons among the nine countries. The statement that the USA is below 70% is only true for part of the period, while its projected rate reaches about 74%. More importantly, saying some countries “are not overweight” misrepresents the chart, which shows overweight proportions in every country. The claim that the USA, England and Austria are projected to be overweight is also unclear and unsupported. Focus on the overall rise, the highest and lowest projected figures, and notable differences between countries.
Coherence and Cohesion: Band 4.0
The response has a basic sequence: it introduces the chart, names the highest and lowest countries, and ends with a general concluding statement. However, the ideas are not arranged into a clear overview followed by selected comparisons, so the reader does not get a coherent account of how the figures change. Several sentences repeat the same point, such as identifying the USA and Korea as the extremes and then saying the other countries are in the middle. Linking phrases including “We can say” and “At last” do not clarify the relationships between ideas, and the reference to “these countries” is difficult to follow. Group the information into paragraphs and use clear comparisons to create a logical progression.
Lexical Resource: Band 4.5
You use some relevant topic vocabulary, including “rate,” “countries,” “highest” and “lowest,” so the basic subject is recognisable. However, the vocabulary is repetitive and often imprecise, with “rate” and “chart” recurring without specific descriptions of change. Phrases such as “the lest of the countries,” “middle rate,” and “countries that are not overweight” are unclear or inaccurate for describing the data. The response also uses informal, repetitive framing such as “We can say.” To improve, use a small range of precise graph language, for example “proportion,” “rose,” “remained stable,” and “was projected to reach,” and ensure that descriptions match what the figures represent.
Grammatical Range and Accuracy: Band 4.5
The response attempts several simple sentence forms, and the reader can understand some basic comparisons. However, errors in sentence structure, agreement, articles and punctuation are frequent enough to make parts difficult to interpret. For example, “The given chart illustrate us” has incorrect subject–verb agreement and an unnatural object pattern, while “Theres more countries rate is belonging” does not form a clear grammatical sentence. The sentence beginning “projects that overweight is the countries” is also incomplete or malformed. Run-on punctuation is evident where sentences are joined without spaces after full stops. Practise accurate simple clauses first, then add controlled comparisons using forms such as “The rate in X rose from … to …” and “X was higher than Y.”
See this exact question answered at other band scores. The same prompt compared across bands.
Browse more IELTS Writing model answers or get your own writing scored by the same AI examiner.