Band 5.0 IELTS Writing Task 1 Model Answer
Overall Band Score: 5.0 · IELTS Momentum Workout · 2026-11-10
IELTS Writing Task 1 question
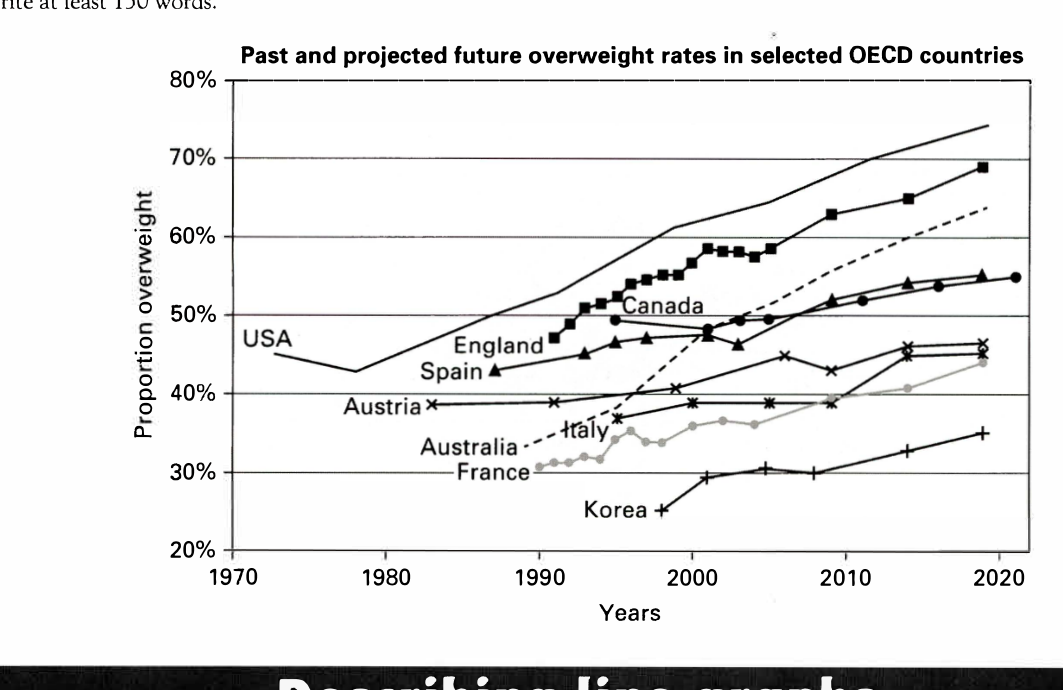
The line graph below shows past and current overweight rates, as well as a projected future overweight rate in nine selected countries.
Summarise the infonnation by selecting and reporting the main features, and make comparisons where relevant.
Past and projected future overweight rates in selected OECD countries
Student answer (Band 5.0)
The line graph elaborates past ,current and projected future overweight rate in nine selected countries.
Overall, the graph represent that most of the countries are gradually increases as compare to others.While other remain constant or stable rate according to the years base.USA is the country with most increase in weight and least increase in korea and italy.
In 1970, overweight rate of USA is 45% a sudden change occur, then it gradually increases until 2020. But Austria, Spain, Italy, Korea remains stable, with minimum or 5 to 10% change. Australia shows a remarkeable change from 30% to 65% with addition of 35% over period of time.
Similarly, France and England shows similar trend with Australia. There figure increase in weight from 1990 to 2020.
In conclusion, the figure demostrates that weight gain is becoming an important topic in future. USA weight gain shows that how rapidly weight is increasing over the past years.
AI examiner evaluation
| Criterion | Band |
|---|---|
| Task Achievement / Task Response | 4.5 |
| Coherence and Cohesion | 5.0 |
| Lexical Resource | 5.0 |
| Grammatical Range and Accuracy | 5.0 |
| Overall | 5.0 |
Task Achievement / Task Response: Band 4.5
You identify the broad upward trend and note that the USA finishes highest, which are relevant main features. However, the overview is too general and includes inaccurate claims: several countries do not remain stable, and Korea and Italy are not the only countries with small increases. The USA rises overall from about 45% to 74%, but the graph does not show a sudden change as described. Australia increases from roughly 34% to 64%, rather than 30% to 65%; England and France also rise, but their trends are not simply identical to Australia’s. The final comment about weight gain becoming an important topic is not a chart summary. The response is 145 words, five below the required minimum, which also limits the detail provided.
Coherence and Cohesion: Band 5.0
The response has a basic structure, with an introduction, an overview, supporting paragraphs and a concluding sentence. This gives the reader some sense of organisation. However, progression between the ideas is limited: the country groupings are not clearly explained, and the paragraph beginning “Similarly” does not specify the figures or comparisons that support the similarity. Linking is also sometimes awkward, as in “Overall” followed by “While other remain constant,” and the conclusion repeats the general idea of rising rates rather than synthesising the main comparisons. To improve, organise the body around clear groups, such as the highest rates and the lower-rate countries, and use transitions to show how each comparison relates to the overview.
Lexical Resource: Band 5.0
You use some relevant vocabulary for describing a graph, including “gradually increases,” “stable rate,” “remarkable change” and “over period of time.” However, the range is limited and several word choices or collocations are inaccurate, which makes parts of the report unclear. For example, “increase in weight” is less precise than describing a rise in the proportion of people who are overweight, and “with addition of 35%” does not clearly express a percentage-point increase. There are also spelling errors such as “remarkeable” and “demostrates.” Aim to use precise trend language consistently and check spelling; this will make your comparisons more accurate and easier to follow.
Grammatical Range and Accuracy: Band 5.0
The response uses mostly simple sentence patterns, with a few attempts to combine ideas, but grammatical errors occur frequently and sometimes make relationships unclear. Examples include “the graph represent,” “most of the countries are gradually increases,” and “France and England shows,” where subject–verb agreement is incorrect. Tense and article use are also inconsistent in “In 1970, overweight rate of USA is 45%,” and the sentence beginning “While other remain constant” is incomplete. Punctuation spacing and sentence boundaries need attention as well. Practise accurate present-tense descriptions of graph data, agreement between subjects and verbs, and complete clauses before attempting more complex comparisons.
See this exact question answered at other band scores. The same prompt compared across bands.
Browse more IELTS Writing model answers or get your own writing scored by the same AI examiner.