Band 5.0 IELTS Writing Task 1 Model Answer
Overall Band Score: 5.0 · IELTS Momentum Workout · 2026-11-10
IELTS Writing Task 1 question
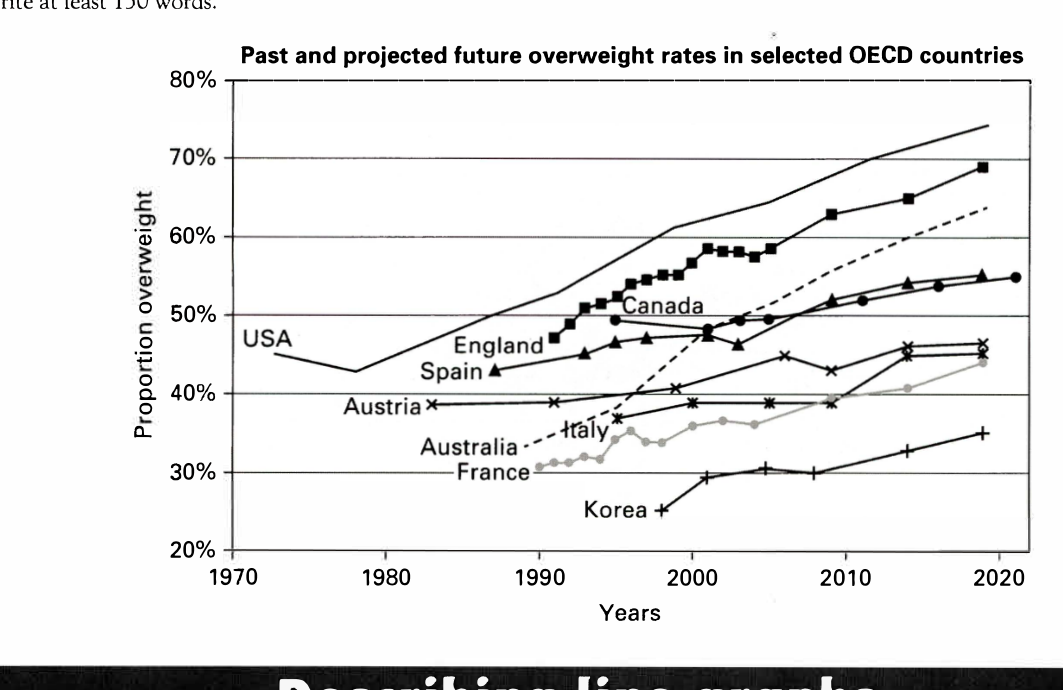
The line graph below shows past and current overweight rates, as well as a projected future overweight rate in nine selected countries.
Summarise the infonnation by selecting and reporting the main features, and make comparisons where relevant.
Past and projected future overweight rates in selected OECD countries
Student answer (Band 5.0)
The line graph describe the previous and continous overweighted people ratio,and the overweight rate project of future in nine countries.
In overview, this is a line graph.The quantity given are the propotion overweight in percentage start from 20 to 80 and the years start from 1970 to 2020 with the nine countries.
Its shows that, the USA starts from 1970 and in between the 40 to 50% of propotion,Australia, Austria, Spain,France and England are started from the year 1980 to 1990 in between the 30 to 50% portion of fatty persons.From 1990 to 2010 Italy , Korea and Canada line began but the Korea start from the 20 to 30% line and all the lines raised to their original where the minimum is Korea from 30 to 40 % and Maximum 70 to 80 % of USA .Mainly, the Australia shows the highest raised from all these countries which started from the 30% in 1990 and raised 60 to 70% in between 2010 to 2020.
AI examiner evaluation
| Criterion | Band |
|---|---|
| Task Achievement / Task Response | 4.5 |
| Coherence and Cohesion | 5.0 |
| Lexical Resource | 5.0 |
| Grammatical Range and Accuracy | 5.0 |
| Overall | 5.0 |
Task Achievement / Task Response: Band 4.5
You identify the graph’s subject and mention several countries, the time span, and the broad contrast between Korea and the USA. However, the response only partially reports the main features: it gives no clear, accurate overview of the overall upward pattern or of how countries compare at the end. Some details are inaccurate or unclear. For example, Australia did not show the greatest rise: its rate increased from about 34% to 64%, while the USA rose from about 45% to 74%. The statement that Australia began at 30% is also imprecise, and the description of when country lines began is confusing. Select key trends and endpoint comparisons, and support them with accurate approximate figures.
Coherence and Cohesion: Band 5.0
There is a basic attempt to organise the response, beginning with an introduction, followed by an overview-like paragraph and a final comparison. The reader can identify the general topic and some country names. However, the ideas do not progress clearly: the second paragraph mixes the graph’s axes, starting dates, ranges, and trends in one long sequence. Connectors such as “and,” “where,” and “mainly” do not make the relationships between these details clear, and references such as “all the lines” and “their original” are difficult to interpret. Grouping countries by high, middle, and low rates, then comparing their changes, would create a clearer progression and make the information easier to follow.
Lexical Resource: Band 5.0
The response uses some relevant topic vocabulary, including “line graph,” “percentage,” “years,” and “raised,” so the subject is generally recognisable. However, the range is limited and several word choices or forms are inaccurate, sometimes making the meaning difficult to understand. Phrases such as “overweighted people ratio,” “portion of fatty persons,” and “highest raised” are not natural ways to describe rates in a graph. “Propotion” is also misspelled, and “continous” is not an appropriate description of the data. Use standard collocations such as “proportion of people who were overweight,” “rate,” “increased,” and “recorded the highest figure” to report trends more precisely.
Grammatical Range and Accuracy: Band 5.0
You attempt to combine information in longer sentences, but the range of sentence structures is limited and these attempts often contain errors that make relationships unclear. For example, “The line graph describe” has subject–verb disagreement, while “Its shows” also uses the wrong verb form. In “Australia, Austria, Spain,France and England are started,” the verb construction is incorrect, and the sentence beginning “From 1990 to 2010 Italy, Korea and Canada line began” lacks a clear grammatical structure. Articles, plurals, punctuation, and sentence boundaries also need more consistent control. Practise writing shorter, complete sentences first, then combine comparisons using accurate past-tense verbs and clear clauses.
See this exact question answered at other band scores. The same prompt compared across bands.
Browse more IELTS Writing model answers or get your own writing scored by the same AI examiner.