Band 4.5 IELTS Writing Task 1 Model Answer
Overall Band Score: 4.5 · IELTS Momentum Workout · 2026-11-11
IELTS Writing Task 1 question
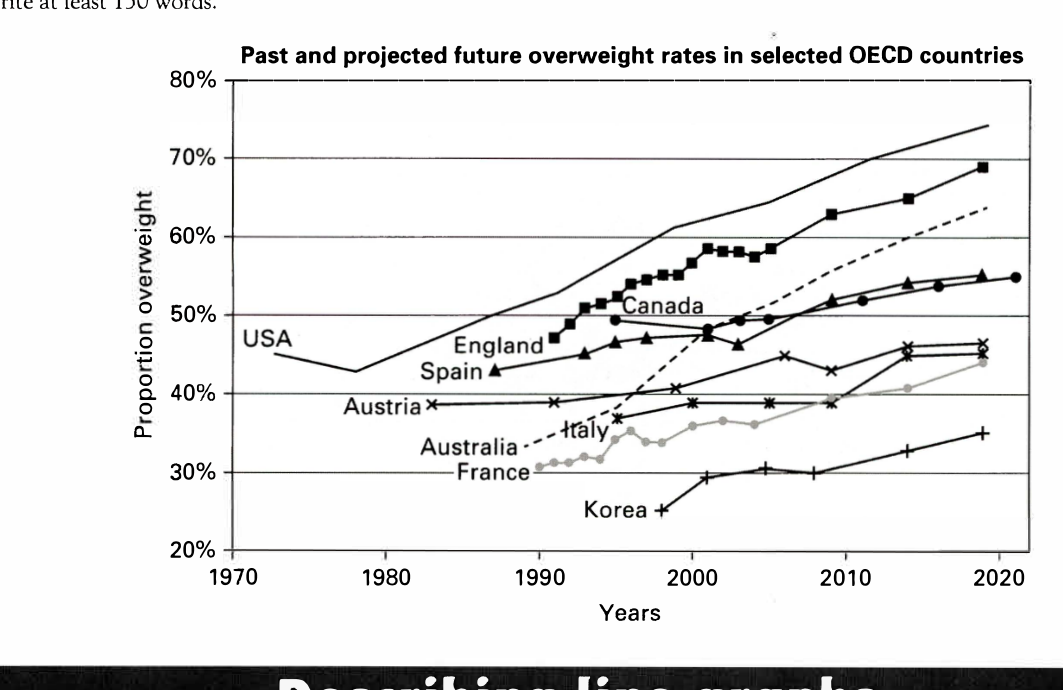
The line graph below shows past and current overweight rates, as well as a projected future overweight rate in nine selected countries.
Summarise the infonnation by selecting and reporting the main features, and make comparisons where relevant.
Past and projected future overweight rates in selected OECD countries
Student answer (Band 4.5)
The line bar illustrates information about past and current overweight, as well as projected future rate in nine countries between 1970 to 2020.
Overall it is clear that usa recorded the highest figures wherease Korea had lowest figure. Further some countries experianced increased the figure while, the other showed decreased the proportion during by the given period.
looking the usa proportion overweight started from 45 percent in 1973 and ending in 2020. Folowed by england starting from 47percent in 1990 while the end of 2020 his proportion awas 69 percent. to begin with the third country canada was start from 1995 on 49 percent and low percent of canada in 2000 however increase th proportion rate in 2020 with 55 percent.
austria proportion overweight started from 1983 and remains stable 1992 after his rate increase further years stop with 45 percent in 2020. these figures clearly shows the pattern of all in
AI examiner evaluation
| Criterion | Band |
|---|---|
| Task Achievement / Task Response | 4.5 |
| Coherence and Cohesion | 4.5 |
| Lexical Resource | 5.0 |
| Grammatical Range and Accuracy | 4.5 |
| Overall | 4.5 |
Task Achievement / Task Response: Band 4.5
You identify the broad comparison that the USA is highest and Korea lowest, and you include some country-specific figures, such as England’s rise from about 47% to 69%. However, the report covers only a few of the nine countries and does not give a clear, accurate overview of the main trends. The USA is described as ending in 2020, but its final value of about 74% is omitted; the claim that some countries decreased is not supported by the chart, which shows overall increases. Canada’s low point is placed in 2000, although the chart’s lowest reported value is around 2001. Select the main patterns across all countries and report comparisons accurately.
Coherence and Cohesion: Band 4.5
There is an attempt to organise the response with an introduction, an overview, and country-specific details, and phrases such as “Overall” and “Followed by” signal relationships. However, progression is difficult to follow because the body moves abruptly from the USA and England to Canada and Austria, while the other countries are not integrated into a clear grouping. Several sentences are incomplete or run together, and the final phrase, “these figures clearly shows the pattern of all in,” is unfinished. Use distinct paragraphs for the overview and grouped comparisons, and connect each point with clear references and transitions so the reader can follow the trends.
Lexical Resource: Band 5.0
You use some relevant chart vocabulary, including “proportion,” “figures,” “highest,” “lowest,” and “increase,” so the topic is generally recognisable. However, the range is limited and several word choices or collocations are inaccurate, such as “line bar,” “increased the figure,” and “low percent.” Spelling errors—including “wherease,” “experianced,” and “Folowed”—also make the writing less clear and weaken control of vocabulary. Aim for precise, conventional expressions for describing data, such as “line graph,” “the rate rose,” and “the lowest proportion,” and check spelling carefully. This would make the comparisons easier to understand.
Grammatical Range and Accuracy: Band 4.5
The response attempts longer sentences and uses some time references, but grammatical control is inconsistent, and errors sometimes obscure the intended meaning. Examples include “between 1970 to 2020,” “usa recorded,” “canada was start,” and “these figures clearly shows”; these show problems with prepositions, verb forms, capitalisation, and subject–verb agreement. Sentence boundaries are also unclear in places, particularly in the long Canada sentence, and the final clause is incomplete. Practise accurate simple past forms for historical data and use a consistent structure, for example, “Canada’s rate began at about 50% in 1994, dipped slightly, and then rose to 55% by 2020.”
See this exact question answered at other band scores. The same prompt compared across bands.
Browse more IELTS Writing model answers or get your own writing scored by the same AI examiner.