Band 5.5 IELTS Writing Task 1 Model Answer
Overall Band Score: 5.5 · IELTS Momentum Workout · 2026-11-11
IELTS Writing Task 1 question
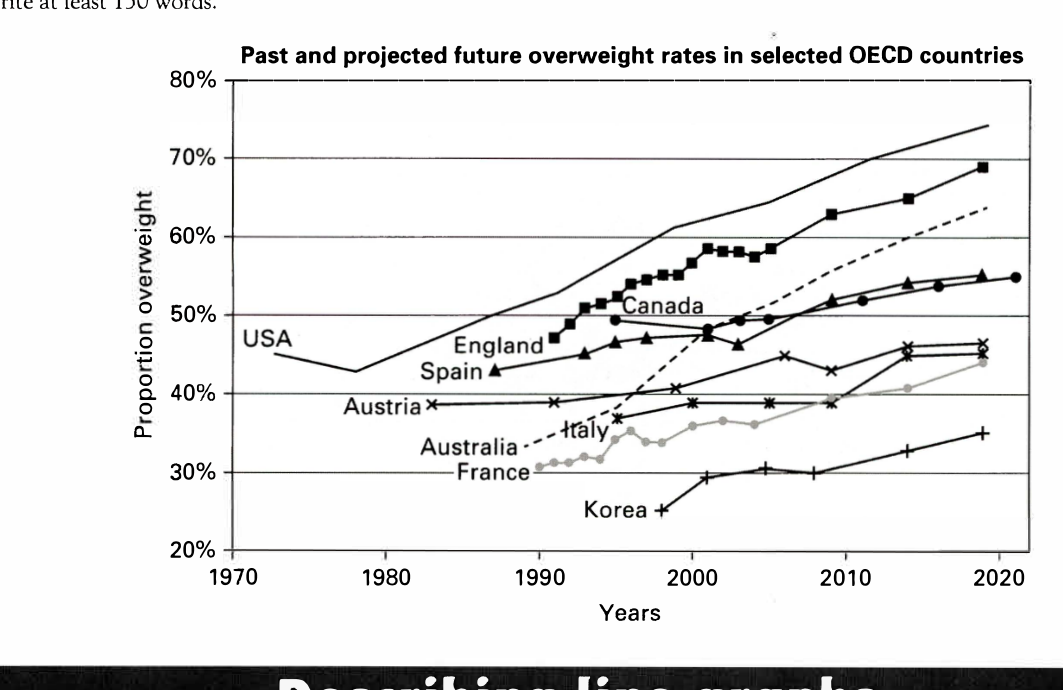
The line graph below shows past and current overweight rates, as well as a projected future overweight rate in nine selected countries.
Summarise the infonnation by selecting and reporting the main features, and make comparisons where relevant.
Past and projected future overweight rates in selected OECD countries
Student answer (Band 5.5)
The line graph demonstrates the past and current overweight rates, as well as predicted future over weight rates in USA , England, Canada, spain , Austria, italy, Australia, France and Korea.
Overall, USA and Englan has the highest number of overweight proportion which accouted for 75% for USA and 70% for england respectively. Other countries like Spain, Canada, Austria, Australia , Italy and France accounted for steady growth. Among all Korea the lowest percentage around 35% among the OECD countries.
Overweight percentage in USA in past from 1970 to 1980 was aroung 45% and same for other selected OECD countries. From 1990 to 2010, the share among all the countries rises quite dramatically, if we see current situation USA takes the lead and is sitting at aorund 60% and england at 53% while the other countries are also catching up.
For future, the graph illustrates, USA accounted for 75% while england at around 70%. Other countries tend to lose their share, while, Korea , spain and Austria are showing negatiove growth among the selected OECD countries.
AI examiner evaluation
| Criterion | Band |
|---|---|
| Task Achievement / Task Response | 5.0 |
| Coherence and Cohesion | 5.5 |
| Lexical Resource | 5.5 |
| Grammatical Range and Accuracy | 5.0 |
| Overall | 5.5 |
Task Achievement / Task Response: Band 5.0
You identify the graph’s subject and provide an overview that correctly places the USA and England at the top and Korea at the bottom. However, several key details are inaccurate or unclear. The USA’s rate was about 45% in 1972 and fell slightly by 1980; it was around 69% in 2010, not 60%. England’s rate was about 63% in 2009, rather than 53%. The claim that other countries “tend to lose their share” is the opposite of the projected pattern: all the listed countries rise overall, including Korea, Spain and Austria. The response also gives little country-by-country comparison. Select accurate start, current and projected figures, and describe the broad upward trend more precisely.
Coherence and Cohesion: Band 5.5
The response has a recognisable structure: an introduction, an overview, and paragraphs referring to past/current and future figures. This gives the reader a basic route through the information. However, progression is weakened by unclear grouping and abrupt shifts, such as moving from the USA’s past figures to all countries’ changes without specifying which period or values are being compared. Connectors such as “Overall,” “From 1990 to 2010,” and “For future” help signal stages, but some links are awkward or contradictory, particularly the claim that countries lose their share after describing growth. Organise the body around clear time periods or groups of countries, and use explicit comparisons to make each paragraph’s focus easier to follow.
Lexical Resource: Band 5.5
You use some relevant task vocabulary, including “overweight rates,” “proportion,” “percentage,” “predicted,” and “growth,” so the topic is generally clear. However, the range is limited and several choices are inaccurate or repetitive. “Highest number of overweight proportion” is an awkward collocation, while “lose their share” does not accurately describe the graph’s rising rates. Spelling and word-form errors—including “accouted,” “aroung,” “aorund,” and “negatiove”—also reduce precision. Use standard expressions such as “the proportion of people who were overweight” and “rose steadily” or “increased overall.” Check country names and spelling carefully, and vary the language used to describe trends and comparisons.
Grammatical Range and Accuracy: Band 5.0
The response attempts both simple and more extended sentences, and the overall meaning is usually recoverable. However, grammatical control is inconsistent, with recurring problems in agreement, articles, sentence construction and punctuation. For example, “USA and Englan has” should use a plural verb, and “Overweight percentage in USA in past from 1970 to 1980 was” lacks a clear grammatical structure. The sentence beginning “Among all Korea” is also incomplete or awkwardly formed. Commas and spaces around country names are inconsistent, and some clauses are joined in ways that make relationships unclear. Practise accurate comparative sentence patterns, such as “The rate in the USA rose from X to Y, while…” and check subject–verb agreement and sentence boundaries.
See this exact question answered at other band scores. The same prompt compared across bands.
Browse more IELTS Writing model answers or get your own writing scored by the same AI examiner.