Band 5.0 IELTS Writing Task 1 Model Answer
Overall Band Score: 5.0 · IELTS Momentum Workout · 2026-11-14
IELTS Writing Task 1 question
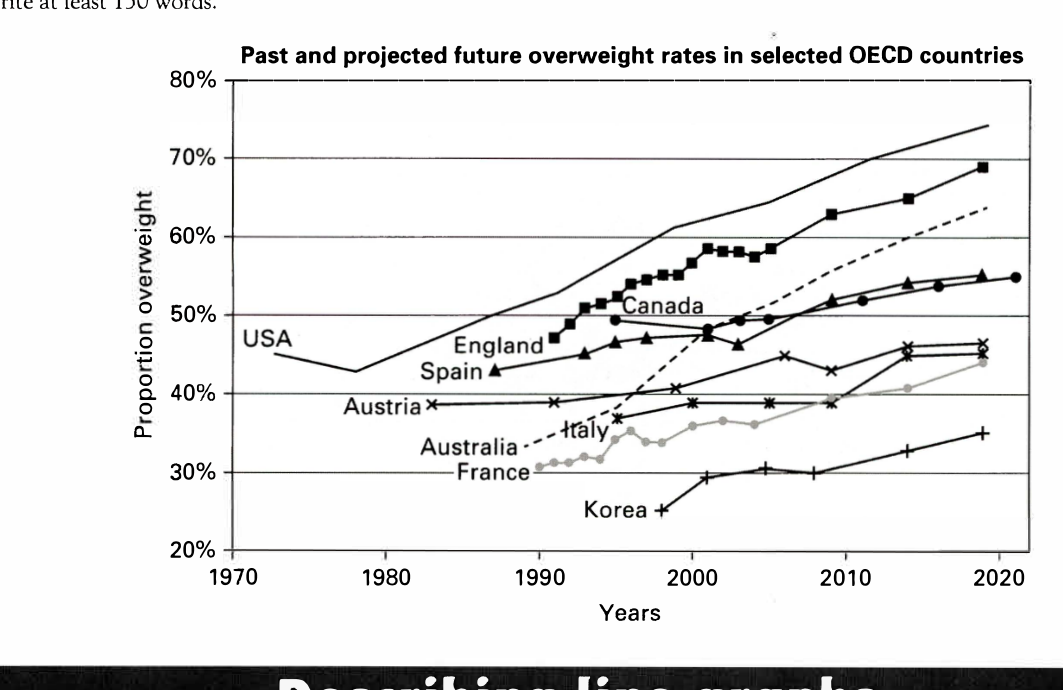
The line graph below shows past and current overweight rates, as well as a projected future overweight rate in nine selected countries.
Summarise the infonnation by selecting and reporting the main features, and make comparisons where relevant.
Past and projected future overweight rates in selected OECD countries
Student answer (Band 5.0)
The line graph illustrates the past and current overweight percentages and also predict the future overweight percentage in the nine different countries.
Overall,the overweight percentage of the USA is on the top the table while the percentage of overweight in Korea was on the bottom of the table .
In 1970, the verweight percentage of the USA was very high form the other 8 countries which was about 47% but in 1980 its percentage become reduce and come to 42% but then USA overweight percentage start a steady flow in the upward direction reach to 75% in the year of 2020.
In 1990 England overweight percentage have a lot of fluctuations i.e its percentage in 1990 was round about 48% and then its percentage reaches to 69% in 2020 .
on the other hand, Canada,Australia and Spain have approximately have about equal percentage (48%) ,also Australia and France have also approximately equal percentage in both years i.e 2010 and 2020 .In comparision to all other countries , Korea is the only country which has very lower percentage its percentage in 1998 was about 23% but than its percentage increase a little bit and come to 32% in the year of 2020
AI examiner evaluation
| Criterion | Band |
|---|---|
| Task Achievement / Task Response | 5.0 |
| Coherence and Cohesion | 5.5 |
| Lexical Resource | 5.0 |
| Grammatical Range and Accuracy | 5.0 |
| Overall | 5.0 |
Task Achievement / Task Response: Band 5.0
You identify two useful overall features: the USA is highest and Korea lowest, and you describe the USA’s rise after an initial decline. However, the response only partially reports the graph’s main patterns. Some figures and dates are inaccurate: the USA begins at about 45% in 1972, not 47% in 1970, and Korea reaches about 35% by 2019, rather than 32% in 2020. The comparison that Canada, Australia and Spain are all around 48% is not clearly tied to a year, while the claim that Australia and France are approximately equal in both 2010 and 2020 is unsupported. Several countries and their trends receive little or no coverage. Select a few accurate comparisons across the period and make the overview more complete.
Coherence and Cohesion: Band 5.5
The response has a basic sequence: an introduction, an overview, and paragraphs describing selected countries. Linking expressions such as “Overall” and “on the other hand” show an attempt to guide the reader. However, progression is uneven because the discussion moves between countries and comparisons without consistently identifying the years being compared. The sentence beginning “on the other hand” combines several claims, making the relationships between them difficult to follow. Referencing is also unclear in phrases such as “both years” and “its percentage.” Use clearer paragraphing to group the highest and lowest trends, then other notable comparisons, and connect each figure explicitly to a date. This would make the organisation easier to follow.
Lexical Resource: Band 5.0
You use relevant vocabulary for describing a graph, including “percentage,” “fluctuations,” “upward direction,” and “approximately.” However, the range is limited and several word choices or collocations are inaccurate or repetitive, which sometimes makes the meaning less clear. For example, “on the top the table” is not a natural way to describe the highest line, and “steady flow in the upward direction” is awkward. There are also spelling and word-form errors, including “verweight,” “form,” and “comparision.” Aim for precise graph language and check spelling carefully. Alternatives such as “the highest rate,” “rose steadily,” and “compared with” would make the description more natural and concise.
Grammatical Range and Accuracy: Band 5.0
You attempt both simple and longer sentences, including clauses joined with “while,” “but,” and “which.” However, control is inconsistent, and errors occur frequently enough to make some sentences difficult to read. Examples include “the overweight percentage … predict,” where the verb form does not agree with the subject, and “its percentage become reduce,” which has an incorrect verb construction. Articles, punctuation, and sentence boundaries also need attention: “Overall,the” lacks a space, and the long sentence beginning “on the other hand” runs several ideas together. Practise accurate past-tense reporting and build complex sentences around one clear comparison at a time. Proofreading for agreement, verb forms, and punctuation would improve clarity.
See this exact question answered at other band scores. The same prompt compared across bands.
Browse more IELTS Writing model answers or get your own writing scored by the same AI examiner.