Band 5.5 IELTS Writing Task 1 Model Answer
Overall Band Score: 5.5 · IELTS Momentum Workout · 2026-11-14
IELTS Writing Task 1 question
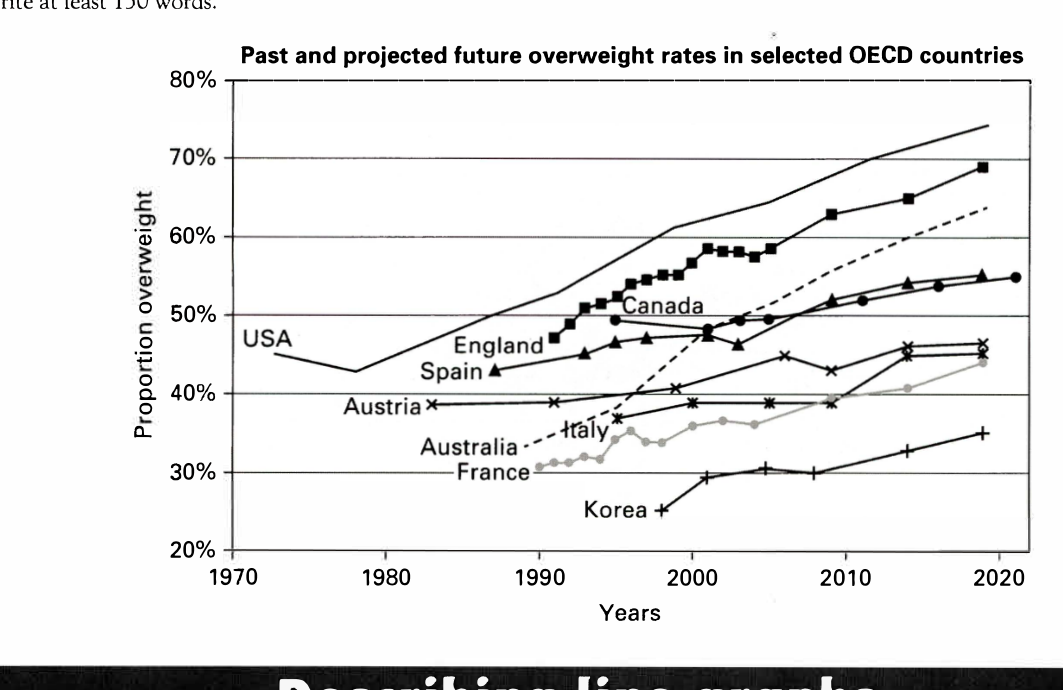
The line graph below shows past and current overweight rates, as well as a projected future overweight rate in nine selected countries.
Summarise the infonnation by selecting and reporting the main features, and make comparisons where relevant.
Past and projected future overweight rates in selected OECD countries
Student answer (Band 5.5)
The line graph shows the past, current and future overweight rayes in nine different countries.
Overall, USA remained the top country with highest proprtion of over weight people, at around 45 percent in early 1970, while korea remained at the bottom with around fifteen percent in the year 1998.
The graph shows that, USA shows a continuos increse in the percentage of overweight people i.e. from 50 percent to approximately more than 70 percent, from the year 1970 to 2020 respectively.England remains at the second spot with constantly increasing percentage of overweight people to 70 percent. The graph is showing surge in the percentage of overweight people in USA and England.
Canada, italy and spain are showing a slight increase in percentage as the years are passing.
France is showing a surge in overwieght ratio from mid seventies to the year 2020.
Conclusively, England and USA remains the top countries with the increasing percentage of overweight people, while korea remains at the bottom.
AI examiner evaluation
| Criterion | Band |
|---|---|
| Task Achievement / Task Response | 5.0 |
| Coherence and Cohesion | 5.5 |
| Lexical Resource | 5.5 |
| Grammatical Range and Accuracy | 5.5 |
| Overall | 5.5 |
Task Achievement / Task Response: Band 5.0
You identify the broad upward trend and give an overview that places the USA among the highest and Korea among the lowest. However, the overview is not fully accurate: the USA is not consistently the top country across the period, and Korea’s rate in 1998 was about 25%, not 15%. Several details are also misreported or too vague. For example, the USA starts at about 45%, rather than 50%, and England reaches roughly 69% by 2019, while the response gives 70% without a clear date. The claim that France rises from the mid-seventies is unsupported; its data begin in the early 1990s. The response also omits important comparisons, especially Australia’s strong rise and the lower rates in France and Korea. Select key figures and describe them accurately to develop the summary more fully.
Coherence and Cohesion: Band 5.5
The response has a recognisable structure: an introduction, an overview, and paragraphs describing groups of countries. This helps the reader follow the general subject. However, progression is limited because several statements repeat the same idea, particularly that the USA and England are rising and remain at the top. The country grouping is also not consistently useful: Canada, Italy and Spain are grouped together as showing a slight increase, although their rates and patterns differ, and Australia is left out. Some links between sentences are abrupt, as in the move from the USA and England to the brief country list. Organise the body around meaningful comparisons, such as the highest, middle and lowest rates, and use clearer references to dates and countries.
Lexical Resource: Band 5.5
You use relevant vocabulary for describing trends, including “increasing,” “surge,” “percentage” and “remained at the bottom,” so the main topic is generally clear. However, the range is limited and some expressions are imprecise or awkward, such as “top spot,” “overweight rayes” and “overweight ratio.” Spelling errors are noticeable, including “proprtion,” “continuos,” “increse” and “overwieght,” which reduce the accuracy and polish of the report. “Slight increase” also understates some changes, such as Australia’s substantial rise. Aim for precise trend language and check spelling carefully; terms such as “proportion,” “rose steadily,” “climbed sharply” and “remained comparatively low” would help you describe the data more accurately.
Grammatical Range and Accuracy: Band 5.5
You produce several understandable simple sentences and attempt longer structures, for example, “The graph shows that…” followed by a trend description. However, the range is limited, and errors in agreement, articles and sentence construction occur repeatedly. In “USA remained the top country with highest proportion,” the article “the” is needed before “USA” and “highest proportion.” “England remains at the second spot” shifts tense, while “England and USA remains” has a subject–verb agreement error. The sentence beginning “The graph shows that, USA shows…” is also awkwardly constructed and repeats the verb. Use past tense for historical data and future forms for projections, and practise combining comparisons into accurate sentences with consistent subjects and verbs.
See this exact question answered at other band scores. The same prompt compared across bands.
Browse more IELTS Writing model answers or get your own writing scored by the same AI examiner.