Band 5.0 IELTS Writing Task 1 Model Answer
Overall Band Score: 5.0 · IELTS Momentum Workout · 2026-11-14
IELTS Writing Task 1 question
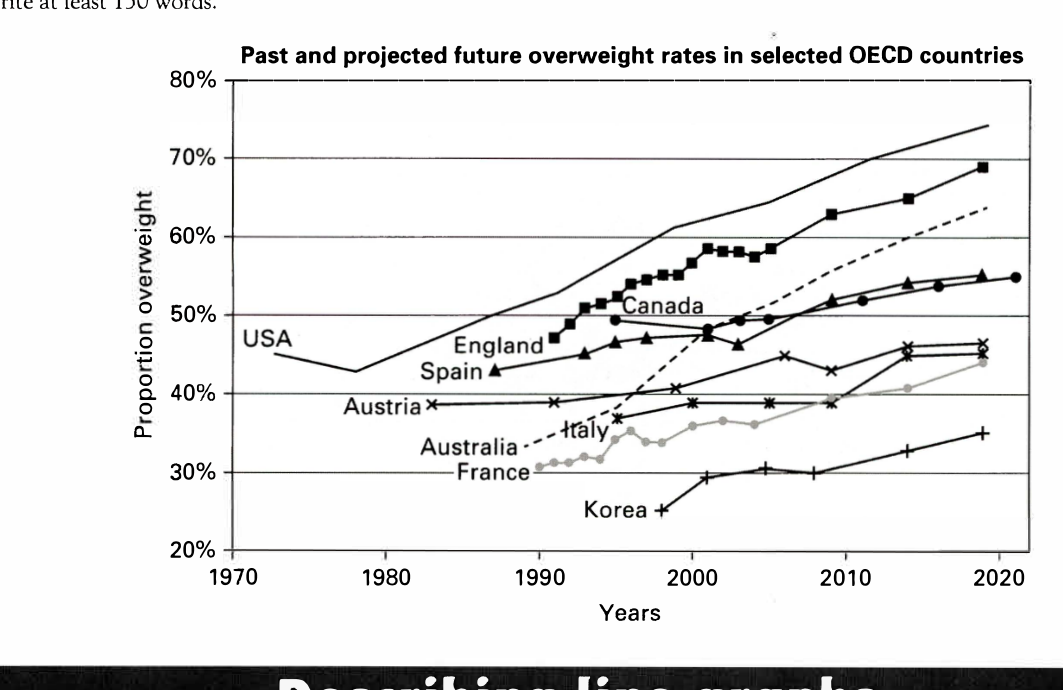
The line graph below shows past and current overweight rates, as well as a projected future overweight rate in nine selected countries.
Summarise the infonnation by selecting and reporting the main features, and make comparisons where relevant.
Past and projected future overweight rates in selected OECD countries
Student answer (Band 5.0)
We have a ligne graph shows past and current overweight rates from 1970 till 2020, as well as a projected future overweight rate in nine selected countries, which are:Usa, Austria, Spain, England, Canada, Italy, France, Korea, Australia. The propotion weight are from 20% and increase until 80%. First, we can notice that the country with the highest rate is Usa above 40% before 1985 and it increase and reach more than 70%. In other hand, the lowest is korea by having only 25% before the year 2000 and it increase gently and reach 35% only in 2020, that tells us the différences between the two countries in matters of taking of their health and also their food quality. Also, those 9 countries split in two categories, one that contain Korea, France, Australia, Austria, Italy, that shows they are lower than 40% before 1995 and they stood under 50% which tells that those are the healthy countries. The other category contain Spain, England, Usa, Canada, they are the countries above 40% overweight and onoy two of them which are Usa and England increased too much that it reach 70% overweight.
AI examiner evaluation
| Criterion | Band |
|---|---|
| Task Achievement / Task Response | 5.0 |
| Coherence and Cohesion | 4.5 |
| Lexical Resource | 5.0 |
| Grammatical Range and Accuracy | 5.0 |
| Overall | 5.0 |
Task Achievement / Task Response: Band 5.0
You identify the broad pattern that the USA has the highest rate and Korea the lowest, and you include approximate figures that broadly match the graph: the USA rises to about 74%, while Korea reaches roughly 35%. However, the response only partially summarises the data. It lacks a clear overview of the overall upward trend across the countries, and the grouping claim that five countries “stood under 50%” is inaccurate: Australia rises well above 50%, while Canada reaches about 55%. The claim that only the USA and England increased substantially also overlooks Australia’s rise from around 34% to 64%. Avoid unsupported conclusions such as calling countries “healthy” or inferring differences in food quality; focus on describing the plotted rates and comparisons.
Coherence and Cohesion: Band 4.5
There is some organisation: the response moves from identifying the highest and lowest countries to grouping the remaining countries, and connectors such as “First” and “Also” signal these stages. However, the progression is difficult to follow because the grouping is not clearly defined and several ideas are packed into long sentences. For example, the sentence beginning “Also, those 9 countries split in two categories” combines a classification, a trend claim and an interpretation without clear separation. The response also lacks paragraphing and a distinct overview, so the reader has to infer the main message. Organise the report into an introduction, an overview, and one or two paragraphs comparing the main trends, using linking phrases only where they clarify the relationship between points.
Lexical Resource: Band 5.0
You use some relevant task vocabulary, including “rate,” “increase,” “highest,” “lowest” and “categories,” so the main subject is generally understandable. However, the range is limited and several word choices or spellings are inaccurate, sometimes making the meaning less clear. Examples include “propotion weight,” “ligne graph,” and “in matters of taking of their health”; the last phrase is especially unclear and is not appropriate for describing chart data. “Increase gently” is also an imprecise description of a trend. Build a more accurate set of graph terms, such as “proportion,” “overweight rate,” “rose steadily,” “remained below,” and “reached a peak,” and use neutral language rather than judging countries as healthy.
Grammatical Range and Accuracy: Band 5.0
The response attempts to connect ideas using clauses and conjunctions, as in “which are” and “that tells us,” but the range of sentence structures is limited and errors occur frequently. Subject–verb agreement and verb forms are inconsistent: “it increase,” “those 9 countries split,” and “it reach” should use forms such as “it increases,” “the countries are divided,” and “it reaches.” Articles and sentence construction also need attention, as in “the country with the highest rate is Usa above 40%,” which is difficult to parse. Punctuation and spacing are inconsistent, including the missing space after “are:”. Practise writing shorter, complete comparison sentences first, then combine them accurately with clauses such as “while” and “whereas.”
See this exact question answered at other band scores. The same prompt compared across bands.
Browse more IELTS Writing model answers or get your own writing scored by the same AI examiner.