Band 6.0 IELTS Writing Task 1 Model Answer
Overall Band Score: 6.0 · IELTS Momentum Workout · 2026-11-16
IELTS Writing Task 1 question
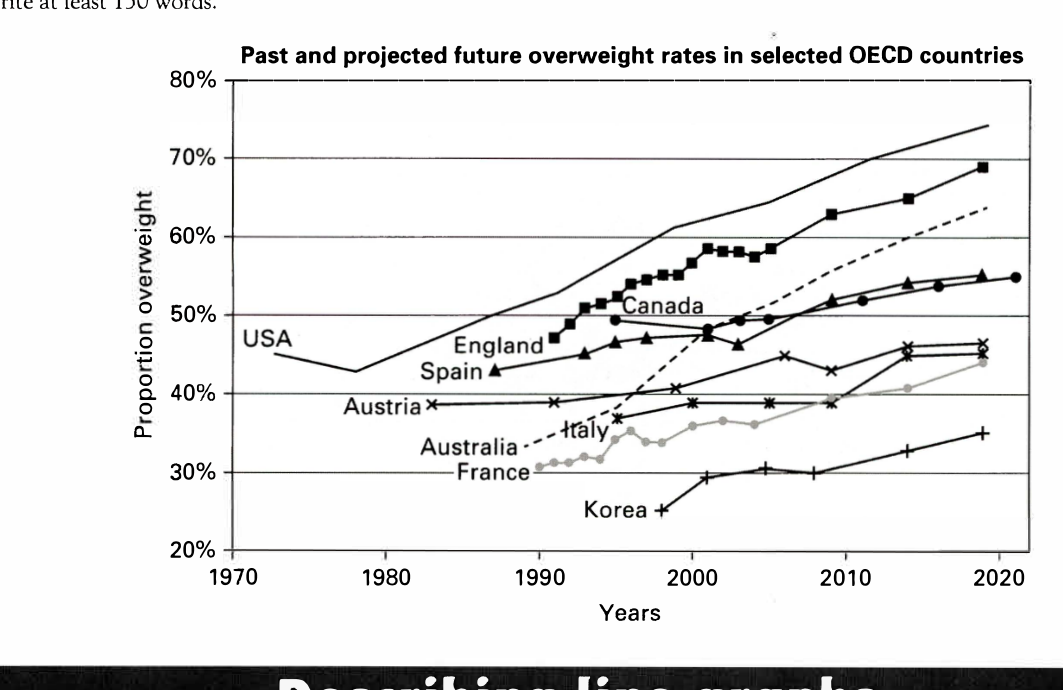
The line graph below shows past and current overweight rates, as well as a projected future overweight rate in nine selected countries.
Summarise the infonnation by selecting and reporting the main features, and make comparisons where relevant.
Past and projected future overweight rates in selected OECD countries
Student answer (Band 6.0)
The line graph illustrate the proportion of overweight in nine countries since 1970 and the projection for 2020.
Overall, there were significant increase in all the nine countries across the five decades, whereas, USA had the highest, while Korea had the lowest.
To begin with, overweight in Korea started after 1990 at 25% and rose gradually and is expected to hit 35% in 2020, while in France overweight started in 1990 at 30% and increased a little and was fluctuacting. Austria and Italy had relativelly similar gradual growth both starting at over 30% expecting to reach 45% in 2020. Whereas, in Australia it began at 32% in 1985 and increased dramatically over years to 62% in 2020.
In contrast, the overweight in Spain started in 1985 at 42% but had slow growth up to 52% in 2020. On the other hand, England began in 1990 at 48% went up dramatically to 69 % in 2020, while in Canada it began late in 1994 at 49% but increased dramatically to 64% in 2020. USA had overweight as early as 1973, dropping slightly in 1978, but it icreased drastically to 73% in 2020.
AI examiner evaluation
| Criterion | Band |
|---|---|
| Task Achievement / Task Response | 5.5 |
| Coherence and Cohesion | 6.0 |
| Lexical Resource | 6.0 |
| Grammatical Range and Accuracy | 5.5 |
| Overall | 6.0 |
Task Achievement / Task Response: Band 5.5
You provide an overview and cover all nine countries, identifying the USA as the highest and Korea as the lowest, which captures an important overall contrast. However, the overview says rates increased in all countries, although the USA initially fell and several series fluctuate. Some figures and starting points are also inaccurate: Australia begins around 34% in 1990, not 32% in 1985, and reaches about 64%, while Canada is projected at roughly 55%, not 64%. Spain reaches about 55%, rather than 52%, and the USA ends near 74%. The response selects relevant trends, but several comparisons are imprecise and some descriptions, especially for France, are underdeveloped. Report the main patterns more accurately and distinguish historical data from projections.
Coherence and Cohesion: Band 6.0
The response has a clear overall arrangement: an introduction, a general overview, and two body paragraphs grouping countries. This makes the information reasonably easy to follow. Linking expressions such as “To begin with,” “In contrast,” and “On the other hand” help signal movement between groups, although some transitions are mechanical or do not express a clear contrast. The long final paragraph also moves rapidly through five countries, making comparisons harder to track. In addition, “Whereas” begins a sentence fragment after the Austria and Italy comparison. Grouping countries by similar levels or trends, and using clearer links between each comparison, would create smoother progression and more precise cohesion.
Lexical Resource: Band 6.0
You use an adequate range of trend vocabulary, including “rose gradually,” “increased dramatically,” “dropping slightly,” and “fluctuating,” so the main movements are generally understandable. There are also attempts at more formal phrasing, such as “proportion” and “projected.” However, some choices are imprecise or repetitive: “significant increase” is used for all countries despite variation, and “slow growth” is less natural for a rate. Spelling errors such as “relativelly,” “fluctuating” (written as “fluctuating” incorrectly in the response), and “icreased” reduce accuracy. Use precise terms for rates and projections, and check spelling and collocations carefully.
Grammatical Range and Accuracy: Band 5.5
You attempt a mix of simple and complex sentences, including clauses with “while” and “whereas,” and most of the intended meaning remains clear. However, some errors recur in agreement, verb forms, and sentence construction. For example, “The line graph illustrate” needs subject–verb agreement, and “there were significant increase” requires a plural noun or a different construction. The phrase “England began in 1990 at 48% went up” joins clauses without suitable punctuation or a connector, while “Whereas, in Australia…” is an incomplete sentence. Tense choices also shift within descriptions. Review agreement and clause boundaries, and use consistent past forms for recorded data and future forms for projections.
See this exact question answered at other band scores. The same prompt compared across bands.
Browse more IELTS Writing model answers or get your own writing scored by the same AI examiner.