Band 5.5 IELTS Writing Task 1 Model Answer
Overall Band Score: 5.5 · IELTS Momentum Workout · 2026-11-16
IELTS Writing Task 1 question
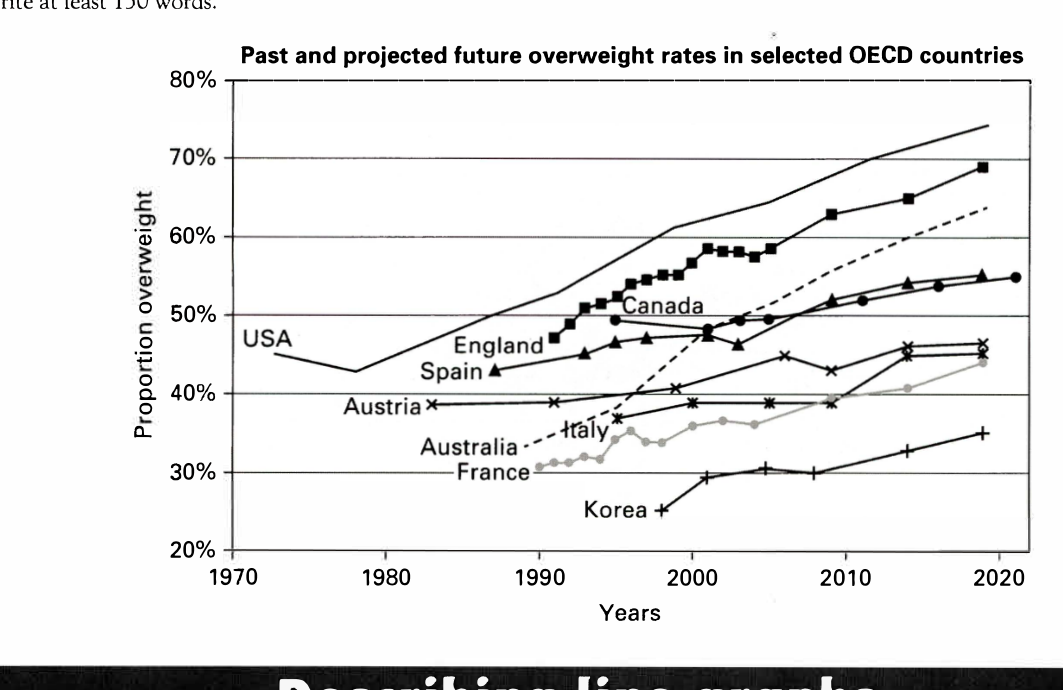
The line graph below shows past and current overweight rates, as well as a projected future overweight rate in nine selected countries.
Summarise the infonnation by selecting and reporting the main features, and make comparisons where relevant.
Past and projected future overweight rates in selected OECD countries
Student answer (Band 5.5)
The line graph depicts the rate of overweight between 1970 to 2020, also projected future overweight rate in Korea, France, Australia, Italy, Austria, Spain, England, Canada and the USA. The data is calebrated in percentge.
overall, it is clear that the highest percentage of overweight rate was in the USA during the period, at approximately 74%. To begin with, rate of England showed the second highest it stood at around 45% in 1990 and rose to 70% in 2020, While the rate in Spain and Canada is approximately similar, at around 55% in 2020 which started from 42% and 49% respectively.
Moving further, the rate in Australia become the doubled of its starting which was 32% in 1990 and reached to 64% by 2020. Whereas France, Austria and Italy started from 30%, 39% and 35% respectively, at the end of the period the rate of theses three nations reached at same proportion, at around 45%.
It can be concluded that the rate of overweight was lowest in Korea throughout the peroid which started from 15% and rose to 35% by 2020.
AI examiner evaluation
| Criterion | Band |
|---|---|
| Task Achievement / Task Response | 5.5 |
| Coherence and Cohesion | 6.0 |
| Lexical Resource | 5.5 |
| Grammatical Range and Accuracy | 5.5 |
| Overall | 5.5 |
Task Achievement / Task Response: Band 5.5
You identify the main overall pattern: the USA is highest by the end, while Korea remains lowest, and you compare several countries. However, some details are inaccurate or unclear. England is described as rising from around 45% in 1990 to 70% in 2020, whereas the graph begins around 47% in 1991 and reaches about 69% in 2019; the broad trend is right, but the dates and figures are imprecise. More importantly, France, Austria and Italy do not finish at the same level: France is about 44%, Austria 46–47%, and Italy about 45–46%. Korea starts near 25%, not 15%. The overview also omits the general upward trend across countries and the USA’s early lead. Select and report the key features more accurately.
Coherence and Cohesion: Band 6.0
The response has a clear basic structure: an introduction, an overview, two groups of comparisons, and a concluding sentence. This makes the information reasonably easy to follow. Linking phrases such as “To begin with” and “Moving further” signal progression, although they sometimes feel mechanical, and “Whereas” does not connect smoothly to the preceding sentence. The final sentence repeats the point that Korea is lowest rather than adding a useful comparison. Grouping countries by their relative rates or trends would create a clearer progression—for example, discuss the highest-rate countries together, then the lower-rate countries. Use more precise references and transitions so that comparisons between countries are explicit rather than relying on a sequence of loosely connected statements.
Lexical Resource: Band 5.5
You use relevant vocabulary for describing a graph, including “rate,” “percentage,” “rose,” “reached,” and “starting.” This is enough to communicate the main subject, but the range is limited and some word choices or collocations are inaccurate. “The rate of overweight” is repeated and sounds unnatural; “the proportion of people who were overweight” is more precise. “The data is calebrated in percentge” contains spelling errors and an unsuitable verb, while “the rate … become the doubled” is not a natural way to describe a rise. There is also repetition of “rate” and “around.” Build a more varied set of accurate trend expressions, such as “increased steadily,” “climbed to,” and “remained comparatively low,” and check spelling before submitting.
Grammatical Range and Accuracy: Band 5.5
You attempt both simple and more complex sentences, including comparisons joined with “while” and “whereas,” and the overall meaning is generally understandable. However, some sentence structures and verb forms are inaccurate. For example, “between 1970 to 2020” should use a consistent time construction, and “the rate … become the doubled” has an incorrect verb form and structure. In “the rate in Spain and Canada is approximately similar,” the plural subject requires a plural verb, and the tense should match the historical data. Several sentences also run together or use punctuation inconsistently, as in the long comparison beginning “To begin with.” Practise forming concise comparison sentences, checking subject–verb agreement and past-tense consistency, and separating complete clauses with appropriate punctuation.
See this exact question answered at other band scores. The same prompt compared across bands.
Browse more IELTS Writing model answers or get your own writing scored by the same AI examiner.