Band 5.5 IELTS Writing Task 1 Model Answer
Overall Band Score: 5.5 · IELTS Momentum Workout · 2026-11-16
IELTS Writing Task 1 question
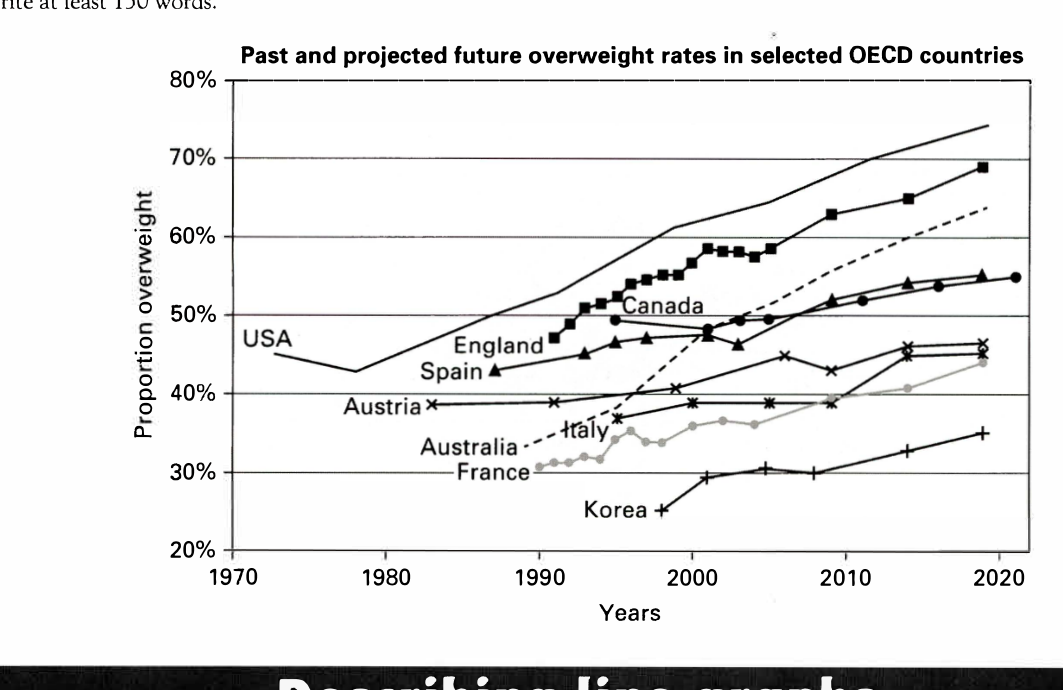
The line graph below shows past and current overweight rates, as well as a projected future overweight rate in nine selected countries.
Summarise the infonnation by selecting and reporting the main features, and make comparisons where relevant.
Past and projected future overweight rates in selected OECD countries
Student answer (Band 5.5)
The graph illustrates about the overweight rates in percentage for 9 various countries.
As per the graph, it was started from UAS which had the highest overweight proportion from 1970 which was nearly 40 percent and then gradually increased to more than 70 percentage by 2020 as per the prediction.The second largest country with highest overweight percentage is Engalnd which started from 1990 to steadly increased to nearly 70 percentage by 2020.Apart from these two countries Canada also had an increasing trend from 2000 to 2020 which will be more than 60 percentage.
Moreover,Australia had an overweight percentage of nearly 35 percentage while in 1990 and it consistently increased up to more than 60 percentage by 2020.Apart from this, austria,itali and france also had a slow increase in percentage from 1990 to 2020.
On the otherhand, Korea is the only one country in the graph with very lass tendency to get oevrweight from 2000 to 2020.Korean pepole seemed to be like health conscious always.
To sum up, almost all the countries had a rise in percentage of people with overweight through given year range of 1970 to 2020.The highest was usa while the least one was Korea
AI examiner evaluation
| Criterion | Band |
|---|---|
| Task Achievement / Task Response | 5.5 |
| Coherence and Cohesion | 5.5 |
| Lexical Resource | 5.0 |
| Grammatical Range and Accuracy | 5.0 |
| Overall | 5.5 |
Task Achievement / Task Response: Band 5.5
You identify the broad pattern that overweight rates rose in most countries and correctly note that the USA was highest and Korea lowest near the end. You also include several relevant comparisons, such as Australia rising from about 35% to above 60%. However, some key details are inaccurate: the USA begins at roughly 45%, not 40%, and Canada reaches about 55% in 2020, not more than 60%. The claim that the USA had the highest rate from 1970 is also too broad, since the graph’s series begin in different years. The overview is present but limited, and Spain is omitted while the country trends are not compared in much detail. Select the main highs, lows and contrasts, and report them precisely.
Coherence and Cohesion: Band 5.5
The response has a recognisable structure: an introduction, paragraphs describing groups of countries, and a concluding summary. This helps the reader follow the general message. However, progression within the body is uneven: the first paragraph moves from the USA and England to Canada, while the next groups several countries together without explaining their relative patterns. Linking phrases such as “Apart from these two countries” and “Moreover” are used, but some connections are unclear or repetitive, and the conclusion largely repeats the opening overview. Organise the details into clearer comparisons—for example, the highest-rate countries versus the lower-rate countries—and use references that make each comparison explicit.
Lexical Resource: Band 5.0
You use some relevant vocabulary for describing trends, including “increased,” “rise,” “percentage,” and “proportion,” so the main topic is generally understandable. However, the range is limited and several word choices or collocations are inaccurate, such as “very lass tendency to get oevrweight” and “slow increase in percentage.” Spelling errors, including “UAS,” “Engalnd,” “itali,” and “pepole,” also reduce clarity and control. The phrase “Korean people seemed to be like health conscious always” is informal and makes an unsupported judgement about people rather than describing the data. Build a more precise set of trend expressions and check spelling and word forms before finishing.
Grammatical Range and Accuracy: Band 5.0
You attempt both simple and longer sentences, and the reader can usually understand the overall trend. However, sentence structures are often faulty or incomplete, and errors occur frequently. For example, “As per the graph, it was started from UAS” has an unclear subject and an incorrect verb construction; “which started from 1990 to steadily increased” also combines incompatible forms. Articles and prepositions are often missing or awkward, as in “while in 1990,” and punctuation is inconsistent, including missing spaces after full stops. Use a clear subject and verb in each sentence, such as “The USA’s rate rose from…” and “England’s figure increased steadily from…”. Practise accurate past and future forms when describing historical and projected data.
See this exact question answered at other band scores. The same prompt compared across bands.
Browse more IELTS Writing model answers or get your own writing scored by the same AI examiner.