Band 5.0 IELTS Writing Task 1 Model Answer
Overall Band Score: 5.0 · IELTS Momentum Workout · 2026-11-17
IELTS Writing Task 1 question
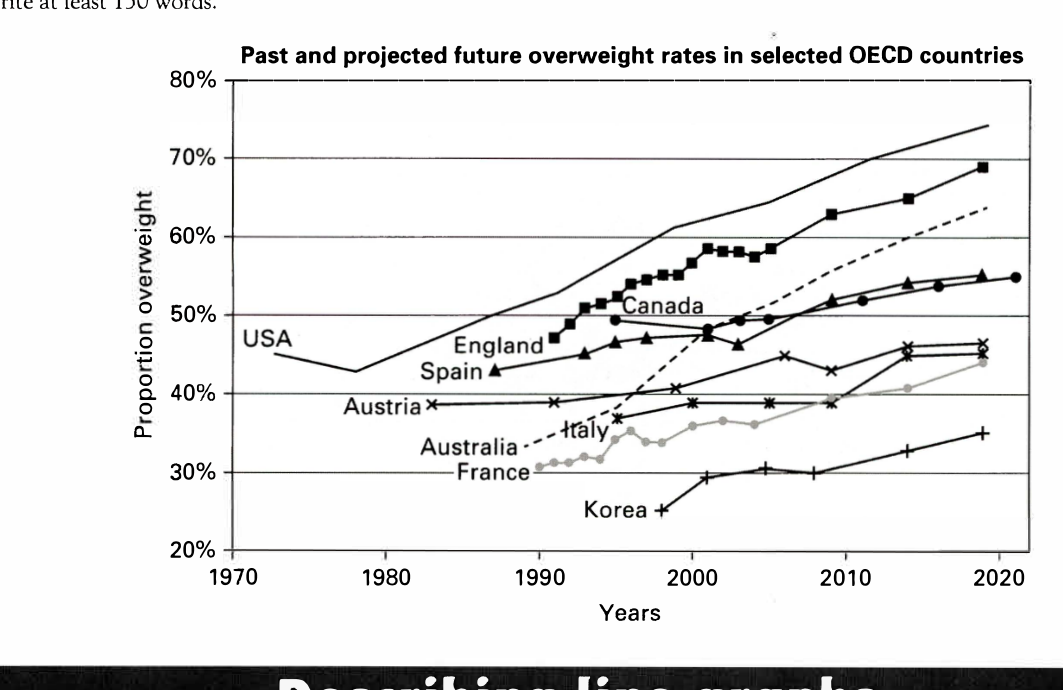
The line graph below shows past and current overweight rates, as well as a projected future overweight rate in nine selected countries.
Summarise the infonnation by selecting and reporting the main features, and make comparisons where relevant.
Past and projected future overweight rates in selected OECD countries
Student answer (Band 5.0)
The line graph illustrates the number of people those who are overweight over a period of 50 years,starting from 1970 in 9 different countries.
Overall it can be seen that,the number of overweight person increased in every countries specially in USA,England,Australia the figure experienced a darstic rise.
According to the graph,the number of overweight person in USA in 1970 was the highest compared to other eight countries,the figure was just below 50%.Though the next year the graph decreased slightly but after that year the graph saw gradual rise and ended at well above 70% in 2020.In 1990 the percantage of people those who were overweight in Australia was just above 30% but in following years the figure had a dramatic increase and ended at just ab ove 60% in 2020.In 2020 Australia has the third most highest overweight person compared to other other countries.Among the nine countries Korea had the least amount of overweight peron in 2000 and after 20 years Korea was accounted for well above 30% which also the lowest figure compared to other countries in 2020.Regarding Spain,Austria,France and Italy faced a slight increase in the figure for overweight person.England was accounted for
AI examiner evaluation
| Criterion | Band |
|---|---|
| Task Achievement / Task Response | 5.0 |
| Coherence and Cohesion | 4.5 |
| Lexical Resource | 5.5 |
| Grammatical Range and Accuracy | 5.0 |
| Overall | 5.0 |
Task Achievement / Task Response: Band 5.0
You identify the broad pattern of rising overweight rates and select several relevant countries, including the USA, Australia and Korea. Some comparisons are accurate: the USA finishes above 70%, Australia above 60%, and Korea remains the lowest in 2020. However, the response only partially reports the graph’s main features. The claim that the USA was highest in 1970 is not supported by the chart, which shows no comparable 1970 figures for most countries; its first value is in 1972. The overview also overlooks important contrasts, such as England’s high rate and the relatively low rates in France and Korea. The final sentence is unfinished, and the other countries’ trends are only briefly mentioned. Select and compare key start/end values more clearly.
Coherence and Cohesion: Band 4.5
The response has a recognisable sequence: an introduction, an overall statement, and a paragraph describing selected countries. This gives the reader some sense of direction. However, progression is weakened by the long, crowded body paragraph, which moves from the USA to Australia, Korea, and then several countries without a clear grouping or consistent comparison. Linking expressions such as “after that year” and “Regarding” are used, but connections between ideas are sometimes unclear, and the final phrase, “England was accounted for,” leaves the response abruptly incomplete. Use separate paragraphs for the overview and grouped comparisons, and organise countries by rate or trend. Clearer referencing and complete transitions would make the information easier to follow.
Lexical Resource: Band 5.5
You use enough topic vocabulary to communicate the subject, including “overweight,” “figure,” “gradual rise,” and “dramatic increase.” There is also some variation in how trends are described. However, several noticeable spelling and word-choice problems reduce precision: “percantage,” “darstic,” and “peron” are misspelled, while “the number of overweight person” is an awkward and repeated phrase. “Third most highest” is also an inaccurate construction, and “accounted for” does not fit naturally when describing a rate. Aim for accurate collocations such as “the proportion of people who were overweight” and “ranked third-highest.” Proofreading spelling and avoiding repeated use of “figure” would help make the vocabulary more controlled.
Grammatical Range and Accuracy: Band 5.0
You attempt both simple and longer sentences, and the overall meaning is usually recoverable. However, errors occur frequently in sentence structure, agreement, articles and punctuation. For example, “the number of overweight person increased in every countries” has problems with number agreement, while “in USA in 1970 was the highest” lacks a clear grammatical structure. Several sentences run together without spaces after full stops or commas, and the final clause, “England was accounted for,” is incomplete. The response also relies heavily on repeated “the figure” sentence patterns, so the range is limited. Practise building accurate comparisons with a clear subject and verb, and check singular/plural forms and sentence boundaries before submitting.
See this exact question answered at other band scores. The same prompt compared across bands.
Browse more IELTS Writing model answers or get your own writing scored by the same AI examiner.