Band 5.5 IELTS Writing Task 1 Model Answer
Overall Band Score: 5.5 · IELTS Momentum Workout · 2026-11-17
IELTS Writing Task 1 question
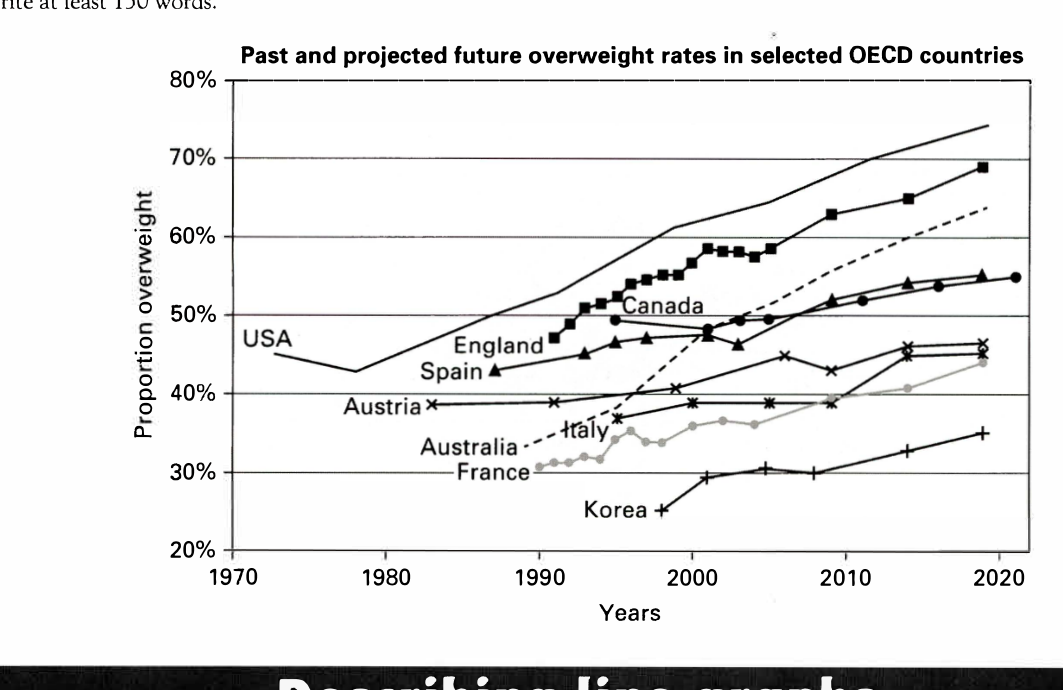
The line graph below shows past and current overweight rates, as well as a projected future overweight rate in nine selected countries.
Summarise the infonnation by selecting and reporting the main features, and make comparisons where relevant.
Past and projected future overweight rates in selected OECD countries
Student answer (Band 5.5)
The line chart depicts the information about past and at present overweight figures, as well as a forecasted future obisity rate in nine different countries- USA, England, Canada, Spain, Austria, Australia, Italy, France, Korea.
Overall, it is clear that the most striking figure showed in USA, England, Australia, and Canada and Spain noticed moterate figure, while Austria, France, Italy, and korea were relatively lowest rates.
USA obesity started at arond 45%, then showed a tiny decrese, after that noticed a dramatic surge from 43% in 1980 to about 74%. In England figure started at roughly 46% and reached close to 70% in 2020. Meanwhile, in Australia in 1990 obisity rates were 32% and in 2020 it reached aroud 64%. Then, In spain and Canada overweight rates started at 42% and below 50% and in 2020 these rates reached at 55% both.
In Italy and France experienced same rates, while Austria started at below 40 and reached 46% in 2020. In contrast, Korea was lowes rate compare to all country from 25% in 2000, and reached to 34% in 2020.
AI examiner evaluation
| Criterion | Band |
|---|---|
| Task Achievement / Task Response | 5.5 |
| Coherence and Cohesion | 6.0 |
| Lexical Resource | 5.5 |
| Grammatical Range and Accuracy | 5.5 |
| Overall | 5.5 |
Task Achievement / Task Response: Band 5.5
You identify the overall pattern that the USA, England, Australia, Canada and Spain have higher rates than the other countries, and you include several relevant figures. However, the overview is imprecise: calling the USA, England, Australia and Canada the “most striking” does not clearly state that the USA is highest, while Spain and Canada are grouped together despite different starting points. Some details are inaccurate or unclear: Australia is about 34% in 1990, not 32%; Spain begins at about 43%, not 42%; and the chart’s final data points are around 2019–2020 rather than all being exactly 2020. The comparison that Italy and France had the “same rates” is also unsupported. Select the clearest highs, lows and overall rises, then report comparisons accurately.
Coherence and Cohesion: Band 6.0
The response has a recognisable structure: an introduction, an overview and two paragraphs describing groups of countries. This gives the reader a coherent overall route through the information, and transitions such as “Meanwhile” and “In contrast” help signal comparisons. However, the grouping is not always logical or fully clear. The overview lists countries by broad rate levels without explaining the main contrast, and the final paragraph moves from Italy and France to Austria and Korea without a clear organising principle. Some linking is mechanical, and “Then” does not clearly show the relationship between the Spain and Canada figures. Group countries by comparable levels or trends, and use explicit comparisons to make the progression easier to follow.
Lexical Resource: Band 5.5
You use relevant chart vocabulary, including “forecasted,” “dramatic surge,” “rates,” and “reached,” and the reader can generally understand the intended trends. However, word choice and spelling errors are noticeable, including “obisity,” “moterate,” “decrese,” and “lowes.” Some expressions are also imprecise or unnatural: “the most striking figure showed in” and “noticed moderate figure” do not clearly describe the data, while “same rates” overstates the similarity between Italy and France. Use standard terms such as “proportion” or “rate,” and choose precise verbs such as “rose,” “fell,” and “stood at.” Proofreading spelling and collocations would make the description more accurate and fluent.
Grammatical Range and Accuracy: Band 5.5
You attempt a mix of simple and more complex sentences, including the contrast in “In contrast, Korea was…” and the sequence describing the USA’s rise. The main trends are usually understandable, but some grammatical errors recur. For example, “In Italy and France experienced same rates” has an unnecessary preposition and lacks an article; “reached at 55%” uses an incorrect verb pattern; and “from 25% in 2000, and reached to 34%” has faulty prepositions and coordination. There are also issues with sentence boundaries and capitalization, such as “Then, In spain.” Aim for complete, well-formed clauses and consistent past-tense reporting, checking articles, prepositions and punctuation as you revise.
See this exact question answered at other band scores. The same prompt compared across bands.
Browse more IELTS Writing model answers or get your own writing scored by the same AI examiner.