Band 4.0 IELTS Writing Task 1 Model Answer
Overall Band Score: 4.0 · IELTS Momentum Workout · 2026-11-17
IELTS Writing Task 1 question
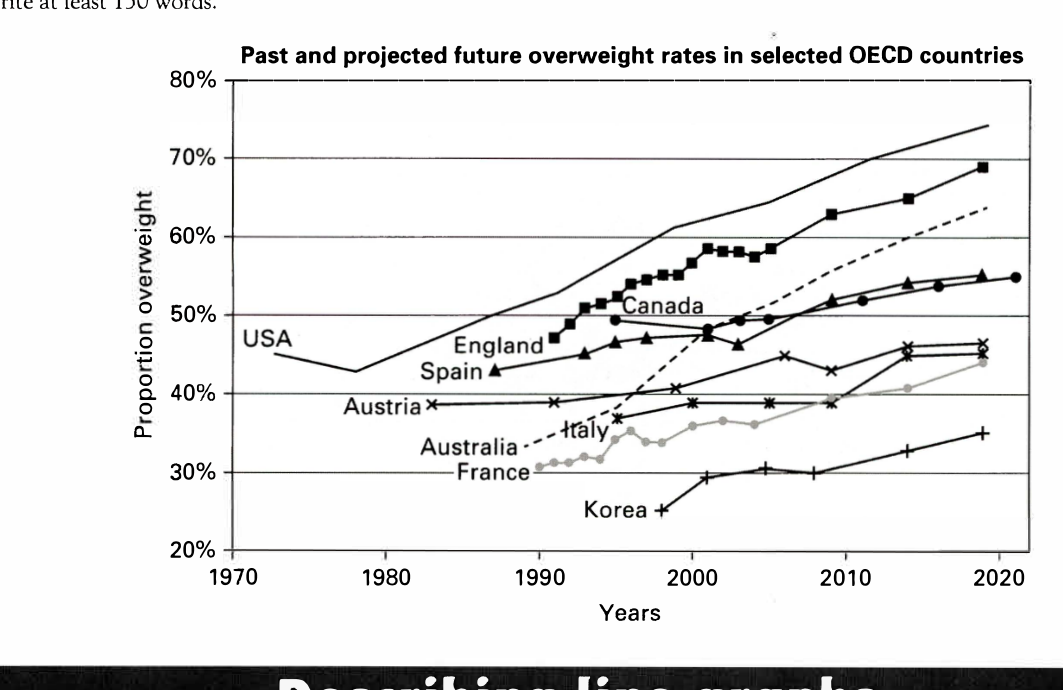
The line graph below shows past and current overweight rates, as well as a projected future overweight rate in nine selected countries.
Summarise the infonnation by selecting and reporting the main features, and make comparisons where relevant.
Past and projected future overweight rates in selected OECD countries
Student answer (Band 4.0)
this pie chart illustrates us about 9 different countries overweight rates first of all we talk about usa in 1970 uk overweigt rates going up from 45 percent to 75 percent in the time period of 1970 to 2020
2nd is england is about is about to 45 to 70 percent
time period of 1990 to 2020
3rd is canada overwight rates is 50 percent in 1995 but there is no big change because in 2020 candada has 55 they improve 5 percent in many years spain is like 42 percent to 45 percent in the time period of 1985 to 2005
austria has 40 percent rates in 1980 in 2020 they make differce of onlu 8 percnet total number of 48 percent in 1995 italy has 35 percent rates in 2020 they improve 10 percent with the number of 45 percent
australia rates in 1990'is 30 percnet but in 2020
they also have grown their rate to 45 percent
AI examiner evaluation
| Criterion | Band |
|---|---|
| Task Achievement / Task Response | 3.5 |
| Coherence and Cohesion | 3.5 |
| Lexical Resource | 4.5 |
| Grammatical Range and Accuracy | 4.5 |
| Overall | 4.0 |
Task Achievement / Task Response: Band 3.5
The response identifies several relevant countries and gives some approximate starting and ending rates, such as the USA rising from about 45% to 75% and Canada reaching roughly 55%. However, it does not provide a clear overview of the graph’s main features, and coverage is incomplete: France and Korea are omitted, while Australia’s final figure is substantially understated at 45% rather than about 64%. Some details are also inaccurate or unclear, including Spain’s stated endpoint and Austria’s figures. The opening calls the visual a pie chart, although it is a line graph. To strengthen the report, summarise the overall pattern and highest and lowest rates, then select accurate comparisons across the countries.
Coherence and Cohesion: Band 3.5
There is a basic attempt to move through the countries in sequence, using markers such as “first of all,” “2nd,” and “3rd.” This gives the response some organisation, but the ideas are mostly presented as one continuous, loosely punctuated passage, so the reader has difficulty seeing where one comparison ends and another begins. Connections between figures are often unclear, as in “in 1995 italy has 35 percent rates in 2020 they improve 10 percent.” The response also stops after Australia without a concluding overview. Use separate paragraphs for an overview and grouped country comparisons, and connect each figure clearly to its year and trend.
Lexical Resource: Band 4.5
The response uses a small set of relevant terms, including “overweight rates,” “percent,” “time period,” and “change,” and the country names make the subject generally recognisable. However, vocabulary is repetitive and often imprecise: “improve” is not suitable for a rise in overweight rates, and “make differce” does not clearly describe a change. Spelling errors such as “overweigt,” “candada,” “percnet,” and “differce” also reduce accuracy. Build a more varied set of chart-description expressions, such as “rose,” “increased,” “remained relatively stable,” and “reached,” and check spelling and collocations before submitting.
Grammatical Range and Accuracy: Band 4.5
The response communicates some basic comparisons through simple clauses, for example, “Canada has 55” and “Australia rates in 1990 … but in 2020…”. However, sentence boundaries and punctuation are frequently missing, producing run-on sequences that make relationships between ideas difficult to follow. There are also recurring problems with articles, agreement, and sentence construction, as in “this pie chart illustrates us about” and “England is about is about to 45 to 70 percent.” Tense and time expressions are not consistently controlled. Practise writing complete sentences with a clear subject and verb, and use a consistent past tense for historical data and “is projected to” for forecasts.
See this exact question answered at other band scores. The same prompt compared across bands.
Browse more IELTS Writing model answers or get your own writing scored by the same AI examiner.