Band 6.0 IELTS Writing Task 1 Model Answer
Overall Band Score: 6.0 · IELTS Momentum Workout · 2026-11-18
IELTS Writing Task 1 question
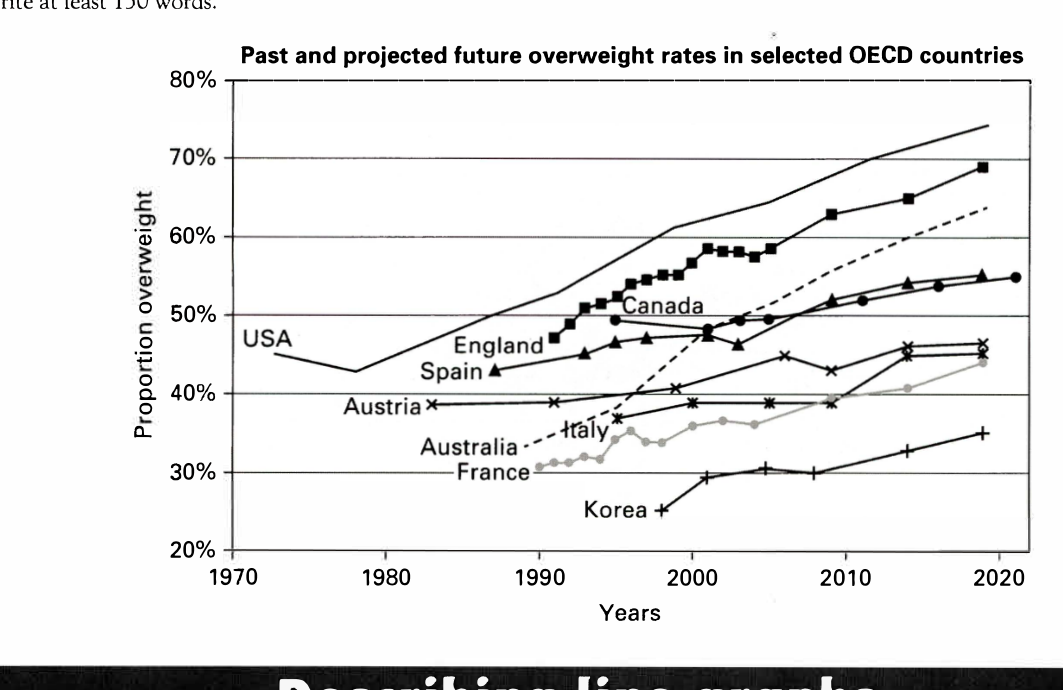
The line graph below shows past and current overweight rates, as well as a projected future overweight rate in nine selected countries.
Summarise the infonnation by selecting and reporting the main features, and make comparisons where relevant.
Past and projected future overweight rates in selected OECD countries
Student answer (Band 6.0)
This line graph illustrates the past, current and projected overweight rates in nine OECD countries, namely; USA, England, Canada, Spain, Austria, Australia, Italy, France and Korea.
Overall the USA had the highest percentage proportions over the years, whereas the Korean population had the least recorded percentages. The overal trend however, shows arise in the percentages for all countries.
England and France show higher variations recorded. The obesity percentage in England is the second highest after the USA. The percentage of obesity has shown a shar upward trend for the population of Australia after 2000, it rose from 49% in 2000 to a projection of 64% in 2020.
The Austrian, Italian and Korean populations show a dip right before 2010 whereas the graph for the USA shows a downfall near 1980s before increasing drammatically from 42% to a predicted percentage of 72% in 2020.
The populations of Italy, Austria, Spain and Canada show the least variations in their trends, although the graph shows a rise for all.
AI examiner evaluation
| Criterion | Band |
|---|---|
| Task Achievement / Task Response | 6.5 |
| Coherence and Cohesion | 6.0 |
| Lexical Resource | 6.0 |
| Grammatical Range and Accuracy | 5.5 |
| Overall | 6.0 |
Task Achievement / Task Response: Band 6.5
You identify the graph’s subject and give a clear overview: the USA is highest, Korea lowest, and rates generally rise. You also select relevant details, including Australia’s increase and the USA’s earlier decline. This meets the task well, with some features more fully reported than others. However, several figures or descriptions are inaccurate: Australia is about 46% in 2000, not 49%, and the USA rises from roughly 43% in 1980 to 74% in 2020, rather than from 42% to 72%. The claim that Austria, Italy and Korea all dip just before 2010 is not supported; Italy is broadly stable before rising, while Korea fluctuates slightly. More precise comparisons and accurate endpoint figures would strengthen the report further.
Coherence and Cohesion: Band 6.0
The response has a recognisable structure: an introduction, an overview, and paragraphs describing selected trends. The main points are generally easy to follow, and contrast markers such as “whereas” help distinguish the highest and lowest rates. However, the progression between details is not always clear. The sentence about England and France’s “higher variations” is not developed, and the next sentence shifts to Australia without a clear link. The final paragraph repeats the general point that rates rise rather than adding a distinct comparison. Grouping countries by similar levels or patterns, then using clearer links between those groups, would make the organisation more purposeful and cohesion less repetitive.
Lexical Resource: Band 6.0
You use an adequate range of task-related vocabulary, including “projected,” “upward trend,” “percentage,” and “variations.” These choices make the topic clear, and you attempt some less common phrasing. However, several expressions are imprecise or awkward: “percentage proportions” is redundant, “higher variations recorded” is unclear, and “a downfall” is not a natural way to describe a decline in a graph. There are also spelling errors, including “overal,” “shar,” and “drammatically,” which reduce accuracy. Prefer concise, conventional graph language such as “proportion,” “fluctuated,” and “fell,” and check spelling carefully. This would make your descriptions more precise without requiring a much wider vocabulary.
Grammatical Range and Accuracy: Band 5.5
You use a mix of simple and more complex sentence forms, including a contrast clause with “whereas” and a sentence describing a change over time. Most of the meaning remains understandable, but some grammatical and punctuation errors are noticeable. For example, “namely;” uses a semicolon where a colon or comma is needed, and “The overal trend however, shows arise” has faulty punctuation and sentence construction. In “it rose from 49% in 2000 to a projection of 64% in 2020,” the structure is understandable but the comparison is not expressed smoothly. Work on punctuation around linking adverbs, sentence boundaries, and consistent grammatical patterns when reporting figures. Greater control of these forms would make the response more fluent and accurate.
See this exact question answered at other band scores. The same prompt compared across bands.
Browse more IELTS Writing model answers or get your own writing scored by the same AI examiner.