Band 5.5 IELTS Writing Task 1 Model Answer
Overall Band Score: 5.5 · IELTS Momentum Workout · 2026-11-18
IELTS Writing Task 1 question
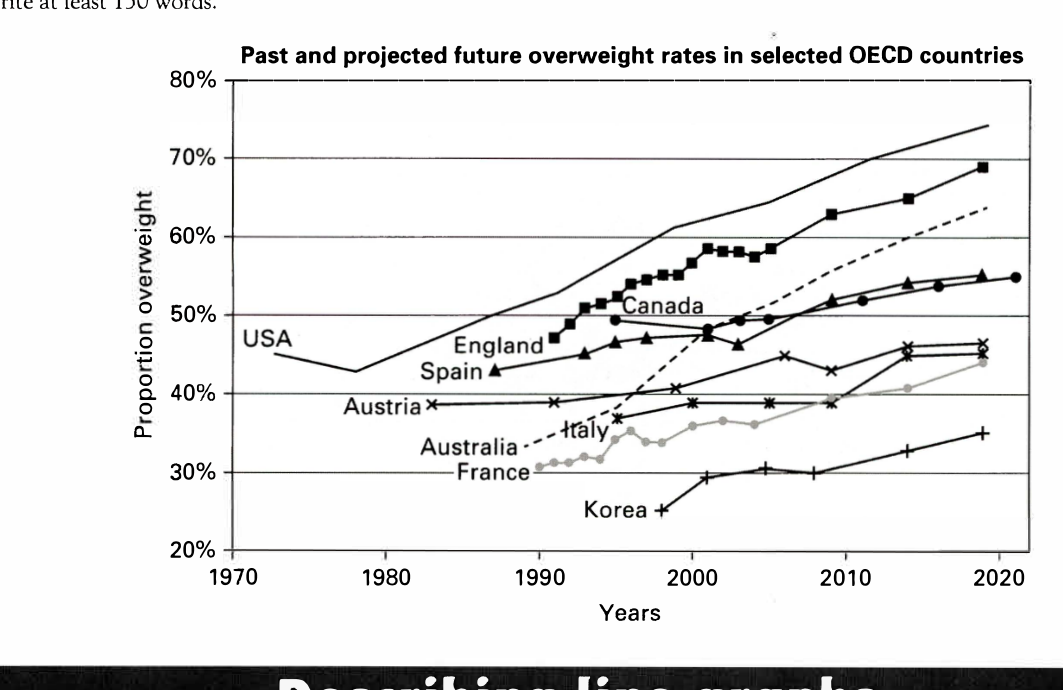
The line graph below shows past and current overweight rates, as well as a projected future overweight rate in nine selected countries.
Summarise the infonnation by selecting and reporting the main features, and make comparisons where relevant.
Past and projected future overweight rates in selected OECD countries
Student answer (Band 5.5)
The line graph illustrates the overweight rates as well as projected future overweight rates in nine selected countries.
The selected countries are USA, England, Canada, Spain, Austria, Italy, France, Korea and Australia.
The overview of graph shows that the USA has the highest rate of overweight people among all countries till 2020 that is approx 73%. On the other hand, Korea is with the lowest rate of 25% overweight people.
The USA has 45% rate in 1970 which slightly decreased to 42% till 1980. Then, the rate rapidly increased to 53% in 1990. Further more, the rate significantly increased to 72 at the very end of 2020.
England has 48% rate at lowest in 1990 the graph slightly increased with fluctuations and the rate increased to 69% till 2020.
Canada has 49% rate in 1993 and in 2000 the graph is at lowest with 48% rate and graph moves slightly upward 55% till 2020.
Italy with lowest at 38% in 1993 and highest at 44% in 2020. Next, Australia with lowest at 33% in 1988 and highest at 63% in 2020. Moreover, France with most fluctions is at lowest at 31% in 1990 and highest at 44% in 2020. Korea with lowest among all at 25% in 1998 and highest at 34% in 2020.
In short the obesity is increased as the time passed till now.
AI examiner evaluation
| Criterion | Band |
|---|---|
| Task Achievement / Task Response | 5.0 |
| Coherence and Cohesion | 5.5 |
| Lexical Resource | 5.5 |
| Grammatical Range and Accuracy | 5.5 |
| Overall | 5.5 |
Task Achievement / Task Response: Band 5.0
You identify the graph’s subject and give a relevant overview, correctly noting that the USA is highest and Korea lowest at the beginning, and you report several broad upward trends. However, the summary is only partial: Austria and Spain are omitted from the country-by-country account, and the overview does not capture the general rise across most countries or distinguish the countries’ different levels. Some details are inaccurate: the USA ends at about 74%, not 72%; Australia begins around 34% in 1990, rather than 33% in 1988; and Italy’s final value is about 46%, not 44%. The closing claim that obesity increased over time is too general. Select key comparisons and report them accurately to develop the response more fully.
Coherence and Cohesion: Band 5.5
The response has a basic overall structure: an introduction, an overview, and paragraphs describing individual countries. This makes the topic and some trends easy to follow. However, the progression is mostly a sequence of country-by-country statements rather than a clear comparison of the main patterns. The overview and final sentence repeat the general idea of rising rates without adding a useful synthesis, while transitions such as “Further more” and “Moreover” do little to show relationships between countries. Grouping countries by their levels or by the size of their increases would create a clearer progression. Use paragraphing to separate the overview from selected comparisons, and connect figures with explicit contrasts rather than relying mainly on “Next” and “Moreover.”
Lexical Resource: Band 5.5
You use relevant graph vocabulary, including “rate,” “increased,” “decreased,” “fluctuations,” and “highest,” so the main information is generally understandable. However, the range is limited and several expressions are imprecise or awkward, such as “has 45% rate,” “the graph moves slightly upward,” and “with lowest.” “Obesity” is also not the same wording as the graph’s measure of people who are overweight, so it is better to retain “overweight rate” or “proportion of people who were overweight.” Spelling errors such as “Further more” and “fluctions” reduce accuracy. Aim for precise collocations and vary trend language, for example, “stood at,” “rose to,” and “remained broadly stable.”
Grammatical Range and Accuracy: Band 5.5
You communicate the main trends using mostly simple sentences and some attempts at more complex structures, such as “Then, the rate rapidly increased…” and “On the other hand…”. However, sentence patterns are repetitive, and errors in articles, sentence construction, and punctuation occur throughout. For example, “The overview of graph shows” needs an article, while “England has 48% rate at lowest in 1990 the graph slightly increased” joins two ideas without a clear grammatical connection. In “the rate increased to 72 at the very end of 2020,” the unit is also missing from the sentence. Use complete, controlled sentences, with accurate articles and punctuation, and practise combining comparisons using clauses such as “whereas” or “while.”
See this exact question answered at other band scores. The same prompt compared across bands.
Browse more IELTS Writing model answers or get your own writing scored by the same AI examiner.