Band 5.5 IELTS Writing Task 1 Model Answer
Overall Band Score: 5.5 · IELTS Momentum Workout · 2026-11-18
IELTS Writing Task 1 question
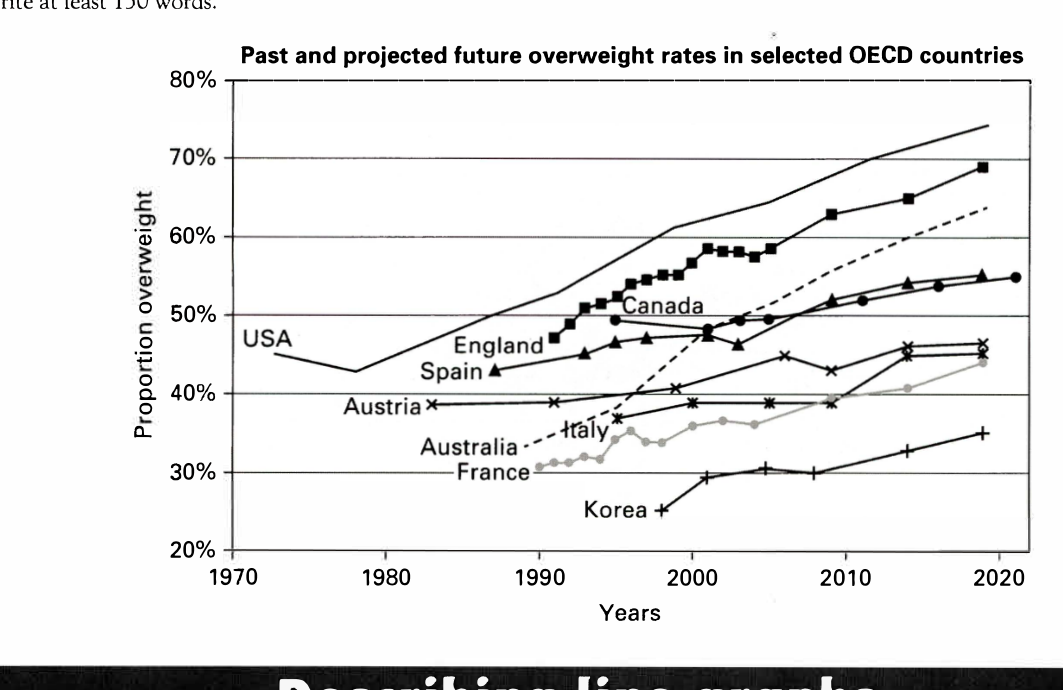
The line graph below shows past and current overweight rates, as well as a projected future overweight rate in nine selected countries.
Summarise the infonnation by selecting and reporting the main features, and make comparisons where relevant.
Past and projected future overweight rates in selected OECD countries
Student answer (Band 5.5)
The line graph illustrates the proportion of present overweight rates, as well as predicted future overweight rate in nine particular countries.
By and large, It is conspicuous that USA has the most obese people among nine countries while Korea has the least number of overweight citizens in their country.
According to the graph, USA had over 45 % overweight people in 1970 and then in 1980 a dramatical fall which was nearly 43%. After 1980 the obesity rate in USA increased gradually and peaked at 70% in 2010. England had shown a volatile trend in terms of overwight percentage and climmed at nearly 65 % at the end of 2010. The obesity in Canada surged from 50% in mid ninties to 55 % in 2010. Spain started with over 40% obesity rate and finished in nearly 55% at 2010 with a noticeable downtrend after 2000. Austria was much more stable in this graph and maintained a steady line till 2000 and then accelerate a rise which ended at over 45 % in 2010. Australia, Italy and France, these three countries almost showed a identical trend in overweight rate and they are also predicted to end in a similar rate at 2020.korea is all different among the countries, it had always the minimum rates of obese people and the projected rate is almost 35% in 2020.
As usual, Us
AI examiner evaluation
| Criterion | Band |
|---|---|
| Task Achievement / Task Response | 5.5 |
| Coherence and Cohesion | 4.5 |
| Lexical Resource | 6.0 |
| Grammatical Range and Accuracy | 5.5 |
| Overall | 5.5 |
Task Achievement / Task Response: Band 5.5
You identify the broad pattern that the USA is highest and Korea lowest, and you report several relevant country trends. However, some details are inaccurate or unclear: the USA reaches about 69% in 2010 and is projected to rise to roughly 74% by 2020, rather than peaking at 70% in 2010. England’s final figure is around 69% in 2019, not 65%, and the response does not clearly distinguish historical data from projections. The claim that Australia, Italy and France end at similar rates is also misleading: their projected figures are approximately 64%, 46% and 44%, respectively. The overview is useful but limited, and several comparisons need more precise support to fully summarise the main features.
Coherence and Cohesion: Band 4.5
The response has a recognisable opening, an overview and a body that moves through several countries, so the reader can follow its general subject. However, most information is packed into one long paragraph, and the sequence of countries does not create a clear comparison or grouping. Linking is also limited: repeated use of “and then” and “while” does not always show how trends relate. The final sentence, “As usual, Us”, is incomplete and disrupts the ending. Organise the report into distinct paragraphs, group countries with similar or contrasting patterns, and use clear transitions such as “By contrast” or “Meanwhile” to guide the reader through the data.
Lexical Resource: Band 6.0
You use a reasonably varied range of trend vocabulary, including “surged”, “volatile trend”, “maintained a steady line” and “noticeable downtrend”. These choices show an attempt to describe movement rather than simply list figures. Some word choices and collocations are inaccurate or imprecise, however: “climmed” is misspelled, “a dramatical fall” is not idiomatic, and “the most obese people” describes people rather than the rate shown. “Overweight” and “obesity” are also used interchangeably, although the graph specifically reports overweight rates. Improve precision by consistently naming the measure and choosing natural collocations. Check spelling and avoid using emphatic terms such as “surged” when the change is gradual.
Grammatical Range and Accuracy: Band 5.5
You attempt both simple and more extended sentence forms, and the main trends are generally understandable. Some grammatical errors remain, particularly in verb forms, articles, agreement and sentence boundaries. For example, “England had shown a volatile trend” uses an unsuitable tense, while “Australia, Italy and France, these three countries almost showed” creates a faulty sentence structure. In “a identical trend”, the article does not agree with the following sound, and “then accelerate a rise” lacks a correctly formed verb. Capitalisation and punctuation are inconsistent, especially in “2020.korea”. Use past simple for completed historical data, future or projection language for forecast figures, and divide long sentences into complete, clearly punctuated clauses.
See this exact question answered at other band scores. The same prompt compared across bands.
Browse more IELTS Writing model answers or get your own writing scored by the same AI examiner.