Band 4.5 IELTS Writing Task 1 Model Answer
Overall Band Score: 4.5 · IELTS Momentum Workout · 2026-11-19
IELTS Writing Task 1 question
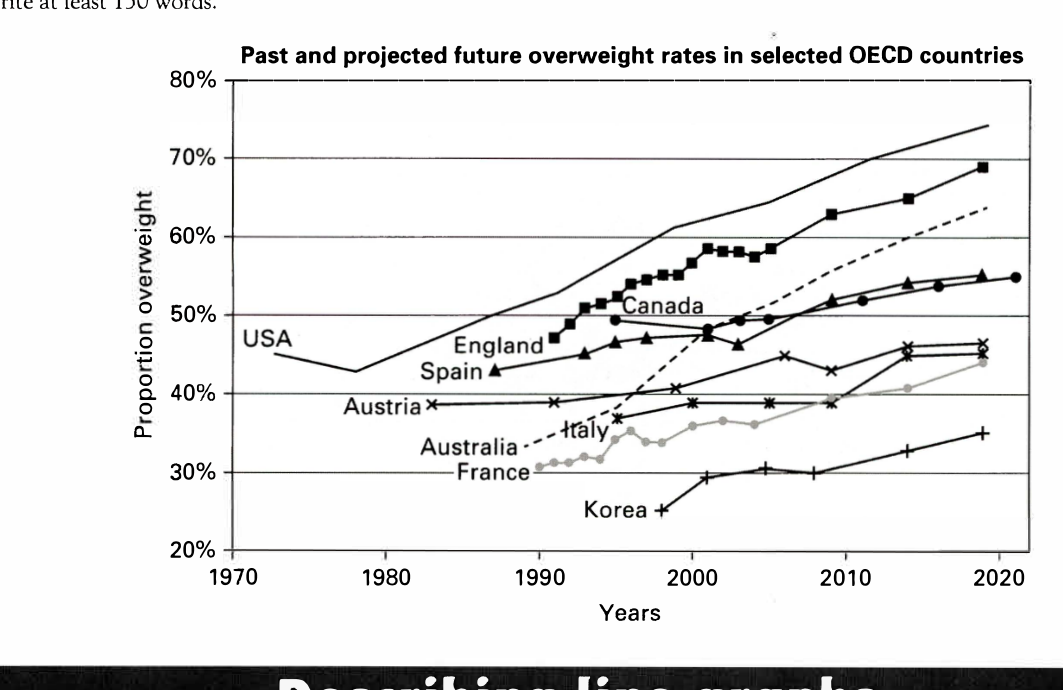
The line graph below shows past and current overweight rates, as well as a projected future overweight rate in nine selected countries.
Summarise the infonnation by selecting and reporting the main features, and make comparisons where relevant.
Past and projected future overweight rates in selected OECD countries
Student answer (Band 4.5)
The line graph illustrates past and current overweight rates, as well as a projected future overweight rate in nine selected countries.
Overall, the obesity rate increased over the year for all countries. The most obsese people are from USA and less overweight individuals are from Korea.
In the 20th century, years between 1970 and 2000 there are less information of all countries. The most available one is the USA the rate of overweight was about 46% in 1973. Between 1973 and 1980 the obesity rate decreased and then again rose to 45% in 1980. In the next decade, the rate constantly increase for the USA and reached about 52% in 1990. Austria's initial rate was approximately 38% in 1993 and it was almost steady and rose to 39% in 1990. In this decade spain was initially at almost 43% and then increased to 45% in 1990. At the end of the decade the Australia an France was respectively at 33% and 31%. In the years between 1990 and 2000, there was significant changed was seen in England, Australia the rate inceased a lot for
AI examiner evaluation
| Criterion | Band |
|---|---|
| Task Achievement / Task Response | 4.0 |
| Coherence and Cohesion | 4.0 |
| Lexical Resource | 5.0 |
| Grammatical Range and Accuracy | 5.0 |
| Overall | 4.5 |
Task Achievement / Task Response: Band 4.0
The response identifies the graph’s general subject and attempts an overview by noting that rates mostly rose and that the USA was highest while Korea was lowest. However, the overview is too broad: the USA is highest at the end, but the response does not clearly summarise the overall pattern across the countries or distinguish the projected figures. Several details are inaccurate or confusing. For example, the USA is reported at about 46% in 1973 and then 45% in 1980, whereas the graph shows about 45% in 1972 and 43% in 1980. Austria’s dates and figures are also muddled, and the account ends mid-comparison. Select a few key trends and give accurate, clearly dated comparisons to make the summary more complete.
Coherence and Cohesion: Band 4.0
There is a basic structure, with an introduction, a brief overview and a paragraph attempting to describe historical data. The chronological approach and phrases such as “In the next decade” give the reader some sense of sequence. However, the information is not arranged coherently enough: the account moves between countries and dates without a clear organising principle, and some comparisons are difficult to follow. The sentence beginning “In the 20th century, years between 1970 and 2000…” is unclear, while the final sentence stops before completing its point. Use separate paragraphs for the overview and selected comparisons, group countries by similar trends or levels, and ensure each sentence develops a complete, connected idea.
Lexical Resource: Band 5.0
The response uses some relevant graph vocabulary, including “rate,” “increased,” “decreased,” “approximately” and “steady,” so the topic is generally recognisable. However, the range is limited and several word choices or forms are inaccurate, which makes parts of the description awkward: “most obsese people” confuses obesity with the proportion overweight, and “less overweight individuals” is not a natural way to describe a rate. There are also spelling errors such as “inceased,” “obsese” and “spain,” and phrases such as “less information” do not express the intended idea precisely. Build a more accurate set of trend and comparison expressions, and check spelling and collocations before submitting.
Grammatical Range and Accuracy: Band 5.0
The response attempts both simple and longer sentence forms, and some basic statements are understandable, such as “The line graph illustrates…” and “The most available one is the USA.” However, control is inconsistent, particularly in longer sentences. Examples include “the rate constantly increase” and “Austria's initial rate was approximately 38% in 1993 and it was almost steady and rose to 39% in 1990,” where verb forms and sentence relationships are faulty. The construction “there was significant changed was seen” is also difficult to process, and the final sentence is incomplete. Practise accurate past-tense reporting, subject–verb agreement and sentence boundaries; shorter, complete sentences would help make the comparisons clearer.
See this exact question answered at other band scores. The same prompt compared across bands.
Browse more IELTS Writing model answers or get your own writing scored by the same AI examiner.