Band 5.0 IELTS Writing Task 1 Model Answer
Overall Band Score: 5.0 · IELTS Momentum Workout · 2026-11-19
IELTS Writing Task 1 question
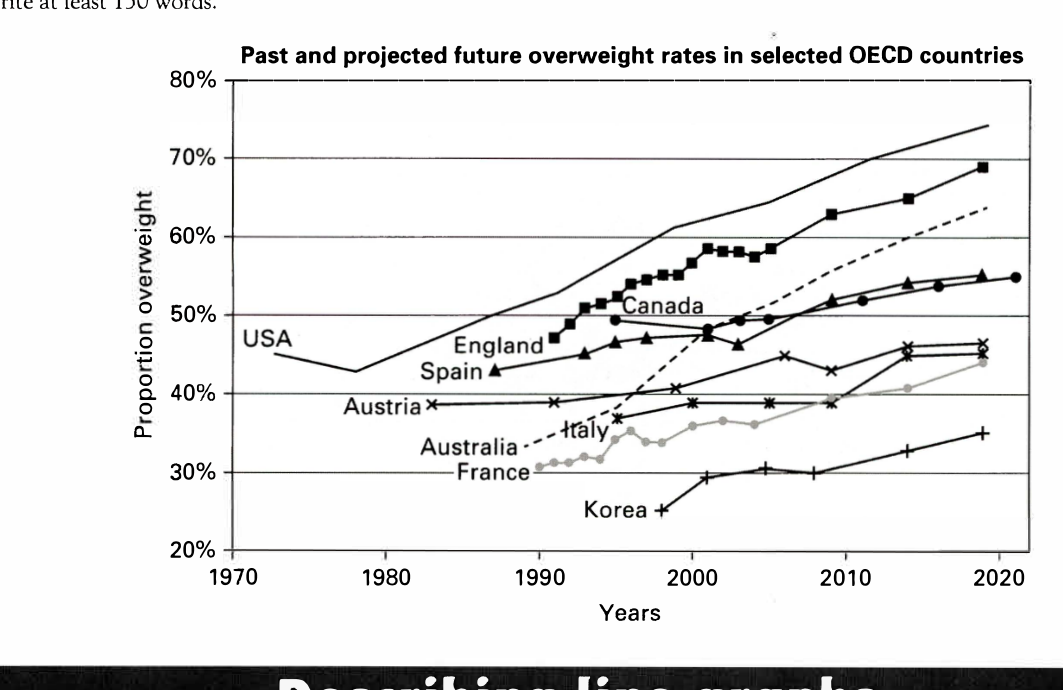
The line graph below shows past and current overweight rates, as well as a projected future overweight rate in nine selected countries.
Summarise the infonnation by selecting and reporting the main features, and make comparisons where relevant.
Past and projected future overweight rates in selected OECD countries
Student answer (Band 5.0)
The line graph demonstrates the information about the past and current overweight rates, as well as a projected future overweight rate in nine selected countries during the period of 1970 to 2020.
Overall, the most dramatic rose in USA., Austria, Italy and France nearly same, Canada and Spain also at the same range, Australia and England rapidly grew and Korea was sharply increase.
The USA. started from 45 percent people was suffer from overweight in 1973 and then little decreased after that increased dramatically and reached to near 75 percent in 2020. The England was started from 1991 was 47 percent then rose sharply in 20000 it was reached near 60 percent approximately the agin grew to nearly touched 70 percent.
In the Canada the proportion of overweight was began with approximately 50 percent then increase gradually and reached to 55 percent in 2020. In Spain the number of individuals was started from roughly 43 percent then climbed slightly and reached over 55 percent in 2020. The Austria was stable in between 1980 to 1990 at roughly 38 percent then gradually surged and reached at 56 percent. The Australia overweight ratio rapidly climbed started from over 30 percent and in 2020 it was over the 60 percent. The France and Korea were began with 30 percent and 25 percent both were quickly grew and reached at the approximately 43 percent and 35 percent.
AI examiner evaluation
| Criterion | Band |
|---|---|
| Task Achievement / Task Response | 5.0 |
| Coherence and Cohesion | 5.0 |
| Lexical Resource | 5.5 |
| Grammatical Range and Accuracy | 5.0 |
| Overall | 5.0 |
Task Achievement / Task Response: Band 5.0
You identify the broad pattern of rising overweight rates and include figures for most countries, with useful endpoint comparisons such as the USA reaching about 75% and Korea about 35%. However, the overview is unclear and partly inaccurate: “the most dramatic rose in USA., Austria, Italy and France nearly same” does not distinguish the much larger increases in the USA and Australia from the smaller rises in Austria and Italy. You also report Austria at 56% in 2020, whereas the chart ends near 46–47% in 2019, and say it was stable from 1980 to 1990, although it rises slightly. The response covers the data only partially because key comparisons are not clearly selected or summarised. The 17 words copied from the prompt are excluded from the stated length count.
Coherence and Cohesion: Band 5.0
The response has a basic paragraph structure: an introduction, an attempted overview, and two paragraphs describing country figures. This gives the reader some organisation, and country names help signal changes in focus. However, there is no clear progression in the overview, which groups countries vaguely as being “at the same range” without explaining the comparison. The body then moves through countries in a list-like sequence, with few links showing which trends are similar or different. Repeated openings such as “The… was started” and “In the…” make the account mechanical, while unclear phrasing sometimes disrupts the flow. Organise the details into meaningful groups—for example, the highest and fastest-rising countries versus those remaining lower—and use clear comparisons to connect them.
Lexical Resource: Band 5.5
You use some relevant chart vocabulary, including “proportion,” “gradually,” “climbed,” and “reached,” and the reader can generally understand the trends you intend to describe. However, the range is limited and several word choices or collocations are inaccurate, which makes parts of the report awkward: “the most dramatic rose,” “people was suffer from overweight,” and “the agin grew” are examples. “Rapidly” and “sharply” are also repeated without always matching the trend; for instance, Korea rises overall but not continuously. Use precise, natural language for describing data, and avoid describing people as “suffering” from a rate. More accurate verbs and phrases would make the comparisons clearer and more formal.
Grammatical Range and Accuracy: Band 5.0
You attempt both simple and longer sentences, and the overall meaning is often recoverable. However, the range is limited, and errors occur frequently in verb forms, agreement, articles, and sentence construction. For example, “The USA. started from 45 percent people was suffer” combines incompatible structures; “The England was started” uses an incorrect article and passive form; and “both were quickly grew” has an incorrect verb pattern. There are also punctuation problems, such as the full stop after “USA” and the run-on construction in the England sentence. Practise building accurate comparison sentences with a clear subject and verb, such as “The rate in the USA began at 45% and rose to about 74%.”
See this exact question answered at other band scores. The same prompt compared across bands.
Browse more IELTS Writing model answers or get your own writing scored by the same AI examiner.