Band 5.0 IELTS Writing Task 1 Model Answer
Overall Band Score: 5.0 · IELTS Momentum Workout · 2026-11-19
IELTS Writing Task 1 question
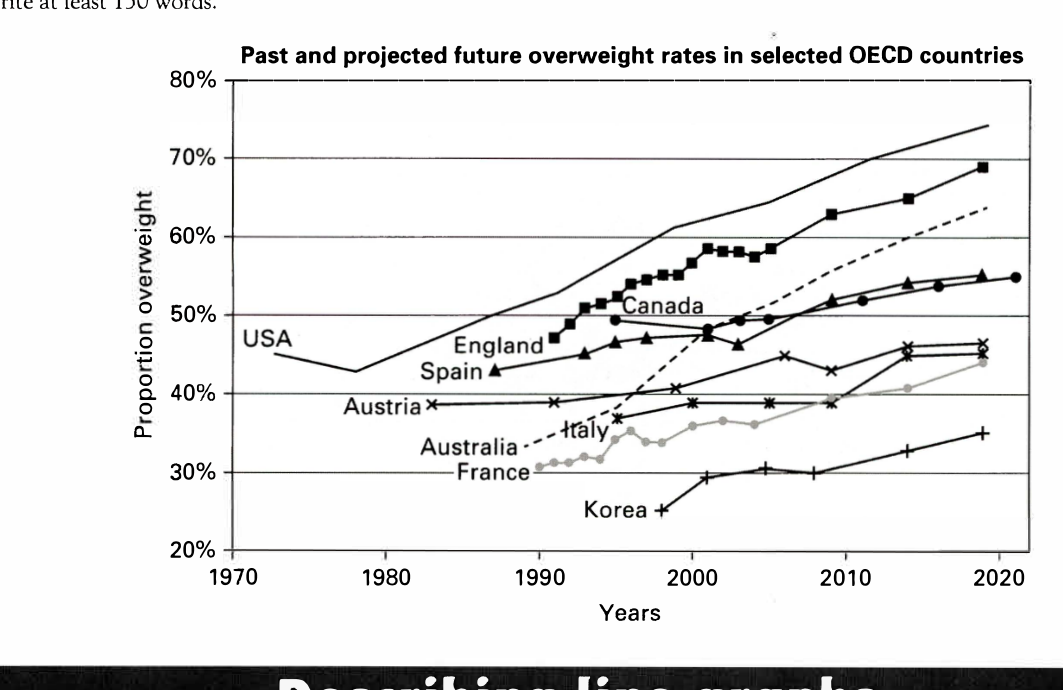
The line graph below shows past and current overweight rates, as well as a projected future overweight rate in nine selected countries.
Summarise the infonnation by selecting and reporting the main features, and make comparisons where relevant.
Past and projected future overweight rates in selected OECD countries
Student answer (Band 5.0)
The line graph illustrates previous and currently overweight rates, as well as a projected future overheavy rate in nine selected countries.
Overall, USA and England showed a steady but significant rise over the period while, Korea is less increasd over the period.
At the biginning, In 1970 USA suddenly decrease from approximately 48% to 42% between 1970 t0 1980 after that it significantly increae from approximately 75% in between 1980 to 2020. England creating fluctuation and then suddenly increase approximately 45% from 1990 to 2020. Canada line initially showed steady and countinue like that and start from the approximately 49% to 54% from1995 to 2020. Spain increase from approximately 43% to 55% in between 1988 to 2020.
Australia,Italy and France increase gradually start from the different year and Austraila start fromt the 1987 and 33% to 48%.
AI examiner evaluation
| Criterion | Band |
|---|---|
| Task Achievement / Task Response | 4.0 |
| Coherence and Cohesion | 5.0 |
| Lexical Resource | 5.0 |
| Grammatical Range and Accuracy | 5.0 |
| Overall | 5.0 |
Task Achievement / Task Response: Band 4.0
You identify the graph’s general subject and report several relevant trends, including the USA’s early decline, later growth, and increases in Canada and Spain. However, the overview is incomplete: it highlights the USA and England but does not clearly summarise the broad pattern across all nine countries or note that Korea remains the lowest. Some figures are inaccurate or unclear: the USA reaches about 74% in 2020, not 75% “between 1980 to 2020,” and Australia is about 34% in 1990 and 64% in 2020, rather than starting in 1987 and reaching 48%. Italy, France and Korea receive little or no meaningful detail. The response is also 21 words below the 150-word minimum, limiting coverage further. Select key comparisons and report them accurately.
Coherence and Cohesion: Band 5.0
The response has a basic structure: an introduction, an overview, and paragraphs describing groups of countries. This gives the reader some sense of how the information is organised. However, progression is uneven, and the final paragraph is incomplete, ending after a brief statement about Australia without developing Italy or France. Connections between ideas are sometimes unclear, as in “after that it significantly increase” and “Canada line initially showed steady and countinue like that.” The overview also does not prepare the reader for the country-by-country details that follow. Use clearer topic sentences to group countries by level or trend, and connect comparisons explicitly. Completing each paragraph and using accurate linking phrases would make the organisation easier to follow.
Lexical Resource: Band 5.0
You use some relevant graph vocabulary, including “illustrates,” “fluctuation,” “approximately,” and “gradually,” so the reader can recognise that you are describing trends and proportions. However, the range is limited and several word choices or forms are inaccurate, sometimes making the meaning difficult to interpret. “Overheavy” is not the appropriate term; use “overweight.” Phrases such as “at the biginning” and “England creating fluctuation” show spelling and word-form problems, while “increase” is repeated frequently. Aim for precise trend language and check spelling carefully. Useful alternatives include “rose,” “declined,” “remained relatively stable,” and “fluctuated,” chosen according to the data rather than repeated as general descriptions.
Grammatical Range and Accuracy: Band 5.0
You attempt to describe changes over time and use some longer sentence patterns, for example, “after that it significantly increase…” However, these attempts are often faulty, and errors in tense, agreement, articles, and sentence boundaries occur frequently. Examples include “USA and England showed … while, Korea is less increasd,” “it significantly increae,” and “Australia,Italy and France increase gradually start.” The sentence about the USA also joins several time periods and changes without clear grammatical structure, making the figures hard to follow. Use past tense for historical data and future forms for projections, and build shorter, complete sentences before attempting more complex comparisons. Check subject–verb agreement and punctuation when joining clauses.
See this exact question answered at other band scores. The same prompt compared across bands.
Browse more IELTS Writing model answers or get your own writing scored by the same AI examiner.