Band 4.5 IELTS Writing Task 1 Model Answer
Overall Band Score: 4.5 · IELTS Momentum Workout · 2026-11-19
IELTS Writing Task 1 question
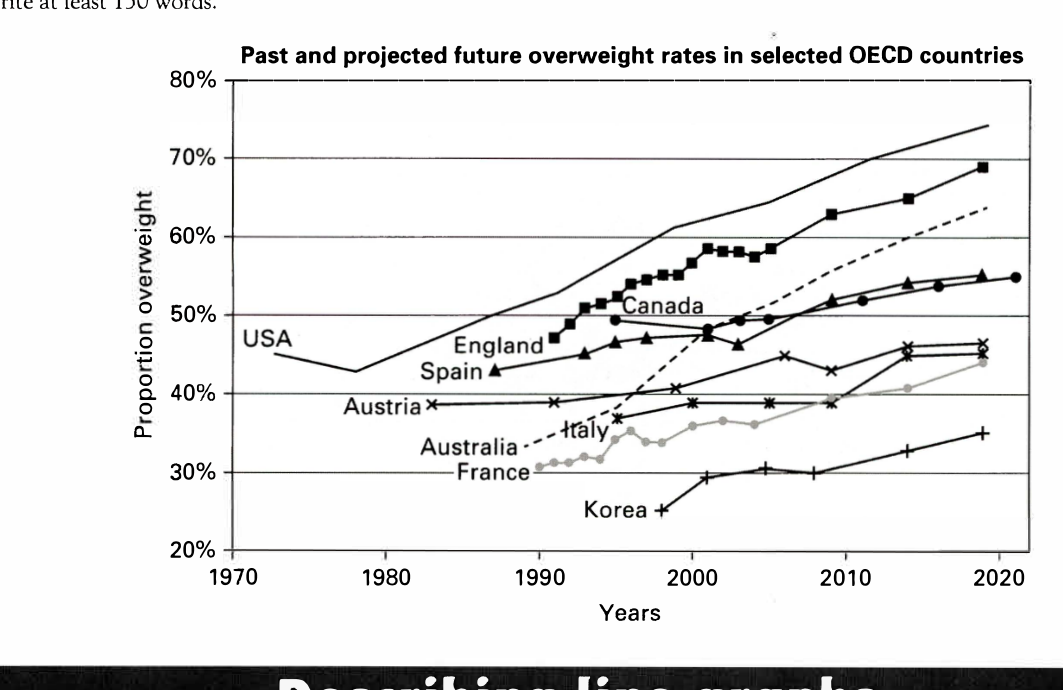
The line graph below shows past and current overweight rates, as well as a projected future overweight rate in nine selected countries.
Summarise the infonnation by selecting and reporting the main features, and make comparisons where relevant.
Past and projected future overweight rates in selected OECD countries
Student answer (Band 4.5)
This graphic is a chengement of weight of people (%) in some country's.
the little percentage is korea (between 25and 35% ,French (between 30 and 45), The rate of overweight is increasing progressively Italia, Austria, Australia, Canada, Spain, England and at liste le most Pourcentage is in Usa
The weight is increasing in order the years.
from 1970 to 2020 there's a big difference and this is not healthy, it is a risk to have some maladies and unhealthy life in the countries.
AI examiner evaluation
| Criterion | Band |
|---|---|
| Task Achievement / Task Response | 4.0 |
| Coherence and Cohesion | 4.0 |
| Lexical Resource | 4.5 |
| Grammatical Range and Accuracy | 4.5 |
| Overall | 4.5 |
Task Achievement / Task Response: Band 4.0
You identify the general subject and several broad features: Korea and France are among the lower-rate countries, while the USA has the highest rate, and you note an overall rise. However, the response reports very little of the graph’s development or makes precise comparisons, so the task is addressed only minimally. For example, the USA rises to about 74% by 2020, while Korea remains lowest at roughly 35%; these are useful features to explain, alongside the substantial increases in Australia and England. The claim that rates increase “in order” is not supported by the data, which includes some fluctuations. The response is also 67 words below the required minimum, leaving too little space to summarise the main features adequately. Include a clear overview and selected figures.
Coherence and Cohesion: Band 4.0
There is a basic attempt to group information: you mention the lower-rate countries, list several others, and then make a general statement about change over time. However, the ideas are not arranged into a clear, coherent summary, and the list in “Italia, Austria, Australia, Canada, Spain, England” does not explain how these countries compare. The opening and subsequent statements also lack clear links, while the final comment shifts from describing the graph to health consequences. Organise the response into a short introduction, an overview of the main trends, and a paragraph comparing selected countries with figures. Use simple linking expressions such as “By contrast” or “Meanwhile” to show relationships between the data.
Lexical Resource: Band 4.5
You use a few relevant terms, including “percentage,” “rate,” “increasing,” and “difference,” so the reader can recognise the topic. However, the vocabulary is basic and sometimes inaccurate or difficult to interpret, as in “a chengement of weight” and “the little percentage.” Country names are also misspelled or incorrectly formed (“Italia,” “French,” and “Usa”), and “maladies” is not a natural choice in this context. Aim for precise graph language and accurate country names, for example, “proportion of people who were overweight,” “the lowest figure,” and “rose steadily.” This would make the comparisons clearer and more appropriate for an academic report.
Grammatical Range and Accuracy: Band 4.5
The response relies on short, simple statements, such as “The weight is increasing in order the years,” and shows little variety in sentence structure. Errors in articles, prepositions, agreement, and sentence construction occur frequently enough to make parts of the meaning unclear. For instance, “in some country's” has an incorrect plural form, while “from 1970 to 2020 there's a big difference” does not clearly express what changed. Capitalisation and punctuation are also inconsistent, including the lowercase opening “the” and the run-on list beginning “the little percentage is korea.” Practise building complete sentences with accurate subjects and verbs, and use past or future forms consistently when describing the graph’s time periods.
See this exact question answered at other band scores. The same prompt compared across bands.
Browse more IELTS Writing model answers or get your own writing scored by the same AI examiner.