Band 4.5 IELTS Writing Task 1 Model Answer
Overall Band Score: 4.5 · IELTS Momentum Workout · 2026-11-20
IELTS Writing Task 1 question
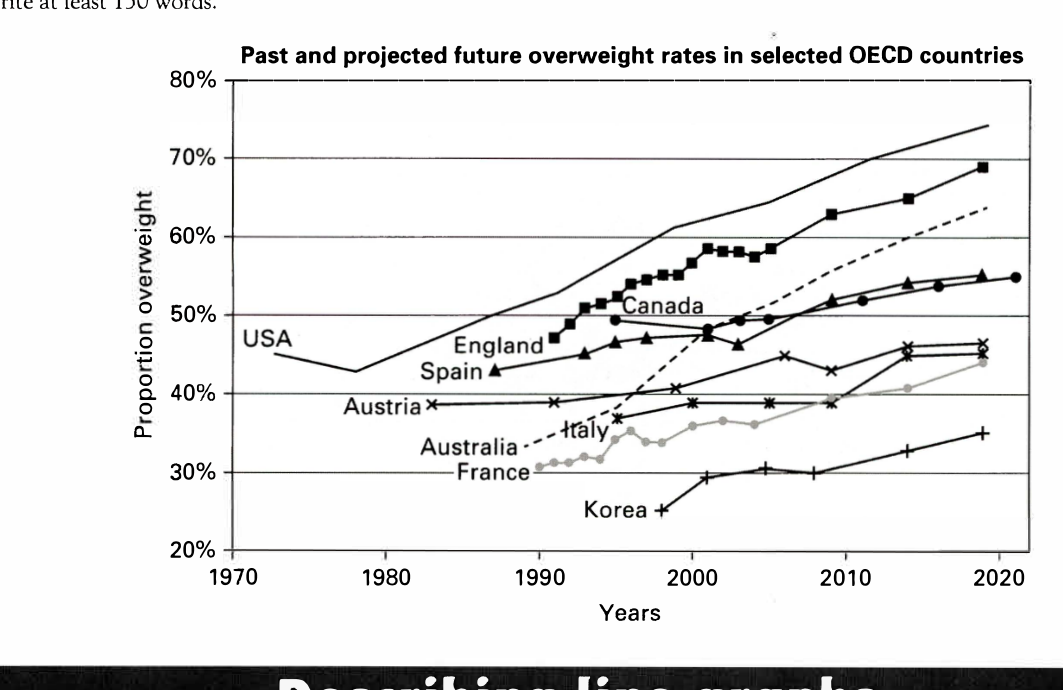
The line graph below shows past and current overweight rates, as well as a projected future overweight rate in nine selected countries.
Summarise the infonnation by selecting and reporting the main features, and make comparisons where relevant.
Past and projected future overweight rates in selected OECD countries
Student answer (Band 4.5)
The line illustrates shows past and current overweight rates, as well as a projected future overweight rate in nine selected countries in 1970 to 2020. The main features, and make proportion overweight past and projected future overweight rate in OECD countries. Overall, total nine countries and make a past and projected future is Canada, USA, England, Spain, Austria, Australia, Italy, France and Korea etc. They all countries has overweight rates projected and one of the most highest increase country is USA. In 1970 USA is decrease 43%, in 1980. In 1980 to 2020 the USA is highest peak increasingly 75% in 2020. In 1990 to 2020 England is increase 45% to 70%. Australia in 1980 to 2020 increase 33% to 65%. Spain is also increase 42% to 56% in 1980 to 2020. Austria is increase same in 1980 to 2000 than after 2000 increase and again decrease in 2010. Moreover, 2010 to 2020 is the same increase 47%. Italy and France they both are increase in 1990 to 2020 38% after is the same and end 2010 than after increase 39% to 45% and it is the same 2020. In addtion France is also increase 30% to 32% than fter decrease 35% and reach 45% in 2020. Last is Korea is 2000 to 2020 increase 30% and it is same 2010 tha after reached 36%. In conclusion, first USA is the most highest peak in this proportion overweight rates.
AI examiner evaluation
| Criterion | Band |
|---|---|
| Task Achievement / Task Response | 5.0 |
| Coherence and Cohesion | 4.0 |
| Lexical Resource | 5.0 |
| Grammatical Range and Accuracy | 4.5 |
| Overall | 4.5 |
Task Achievement / Task Response: Band 5.0
You identify the broad pattern that rates generally rise and correctly note that the USA finishes highest, at about 74–75%. You also include several countries and some figures, so the response is relevant to the graph. However, the overview is unclear and does not effectively summarise the main comparisons across all nine countries. Several details are inaccurate or confusing: the USA begins at about 45% in 1972, not a decrease to 43% in 1970; Australia’s series starts in 1990, not 1980; and Austria does not show a continuing rise followed by a clear fall to 2010. The account of Italy and France also mixes their trends and figures. Select a few reliable comparisons and describe the overall ranking and changes more clearly.
Coherence and Cohesion: Band 4.0
There is an attempt to move from a general statement to country-by-country details, and words such as “Overall,” “Moreover” and “In conclusion” signal stages in the response. However, the ideas are not arranged into clear paragraphs, and the sequence of comparisons is difficult to follow. The opening repeats and distorts the task rather than giving a concise overview, while the final sentence repeats the USA point without adding a useful conclusion. Connections between countries are often unclear, particularly in the sentence beginning “Italy and France they both are increase,” where several trends are combined. Grouping countries by high, middle and low rates, then using one paragraph for the overview and another for key details, would create clearer progression.
Lexical Resource: Band 5.0
The response uses relevant basic terms such as “overweight rates,” “increase,” “decrease” and “reached,” and the reader can identify the countries being discussed. However, vocabulary is repetitive and several phrases are inaccurate or unnatural, which sometimes makes the intended comparison hard to understand. Examples include “the most highest increase country,” “highest peak increasingly” and “the same increase.” Some wording also confuses a rate with a country, as in “USA is decrease 43%.” Use precise trend language and collocations, such as “rose to,” “remained stable,” “fluctuated” and “recorded the highest proportion.” This would make the descriptions more concise and accurate.
Grammatical Range and Accuracy: Band 4.5
You attempt to describe changes over time and use some longer sentence forms, but control of sentence structure is limited, and errors frequently make relationships between figures unclear. For example, “The main features, and make proportion overweight…” is not a complete sentence, while “They all countries has overweight rates projected” has problems with word order and subject–verb agreement. Tense and preposition patterns are also inconsistent, as in “In 1970 USA is decrease 43%” and “in 1980 to 2020.” Many clauses are joined without clear punctuation, especially in the Italy and France section. Practise writing complete sentences with a clear subject and verb, and use consistent past-tense descriptions for historical data.
See this exact question answered at other band scores. The same prompt compared across bands.
Browse more IELTS Writing model answers or get your own writing scored by the same AI examiner.