Band 5.5 IELTS Writing Task 1 Model Answer
Overall Band Score: 5.5 · IELTS Momentum Workout · 2026-11-20
IELTS Writing Task 1 question
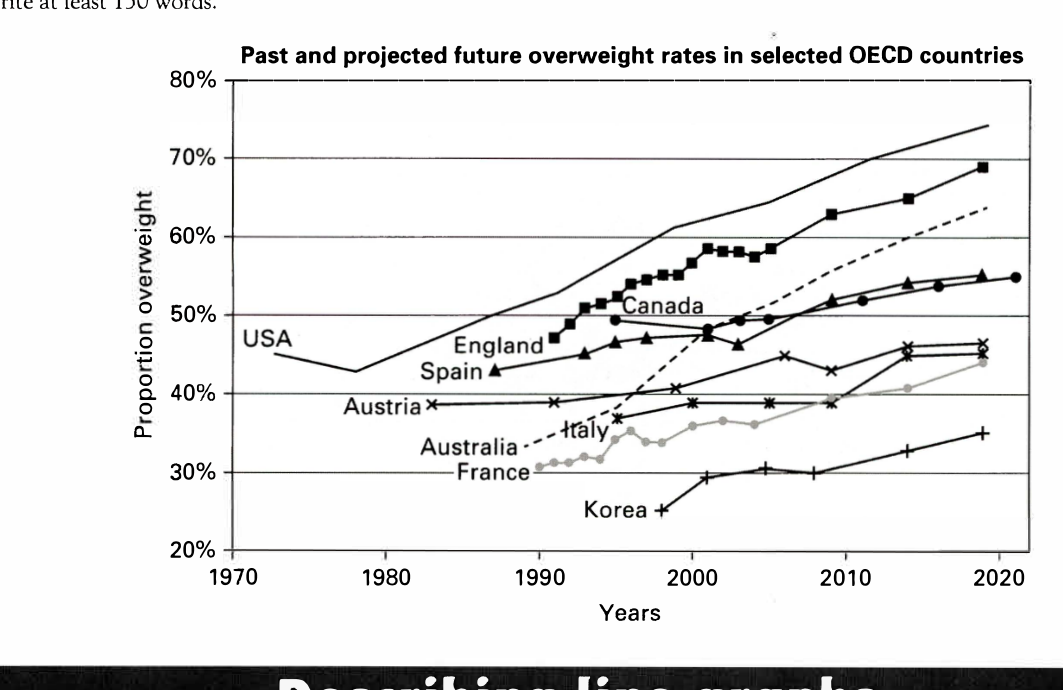
The line graph below shows past and current overweight rates, as well as a projected future overweight rate in nine selected countries.
Summarise the infonnation by selecting and reporting the main features, and make comparisons where relevant.
Past and projected future overweight rates in selected OECD countries
Student answer (Band 5.5)
The given line chart displays obesiety percentage currently and in the past, in addtion to expacted obesiety rate in 9 specefic countries.
Overall, Usa is the higest obesity rate across all nine countries throught all years, while Korea still the lowest one, despite slight increase across all years.
Usa started at 1970 with slight decline below 50% then start increasing until reaching the highest percentgae acroos all 9 countries above 70% at 2020,while England and Australia started below 50% and 40% respectively, they reached above 60% in 2020, also Canada and Spain have slight increase from below 50% to nearly the same point above 50%.
On the other hand, Austria, France and Italy face roughly increase from under 40% to the same point above 40% by 2020 in addtion to Korea that made the lowest percentage cros the 9 countries from almost 25% to 35% starting from 2000 to 2020.
AI examiner evaluation
| Criterion | Band |
|---|---|
| Task Achievement / Task Response | 5.5 |
| Coherence and Cohesion | 6.0 |
| Lexical Resource | 5.5 |
| Grammatical Range and Accuracy | 5.0 |
| Overall | 5.5 |
Task Achievement / Task Response: Band 5.5
You provide a clear overview of the broad pattern: the USA is highest by the end, while Korea remains lowest, and most countries rise. You also make relevant comparisons among groups of countries. However, some claims are too broad or inaccurate. The USA was not highest throughout: it began at about 45%, below England and Canada at some points, and the chart does not show every country across all years. The statement that England and Australia both reached above 60% is accurate, but Canada and Spain finish at roughly 55%, not clearly at the same point. The final comparison groups Austria, France and Italy together despite their different starting and ending levels. Select a few key figures and describe these differences more precisely.
Coherence and Cohesion: Band 6.0
The response has a recognisable structure: an introduction, an overall summary, and two paragraphs comparing groups of countries. This gives the reader a general route through the information, and phrases such as “Overall” and “On the other hand” help signal the organisation. However, the body paragraphs contain several trends in long, crowded sentences, so comparisons are not always easy to follow. The second paragraph, for example, moves from the USA to England, Australia, Canada and Spain in one sentence. The final paragraph similarly combines four countries without clearly separating their patterns. Use shorter sentences and organise the details into clearer groups, such as the highest-rising countries and those with lower final rates.
Lexical Resource: Band 5.5
You use relevant vocabulary for describing a graph, including “decline,” “increase,” “reaching,” and “percentage,” and you attempt to compare rates across countries. However, spelling errors are frequent, including “obesiety,” “addtion,” “expacted,” and “higest,” and these make the writing less clear and polished. Some word choices and combinations are also imprecise: “the same point above 40%” does not clearly describe the different final values, while “face roughly increase” is not a natural way to report a trend. Build accuracy with common chart language and check spelling carefully. For example, use “rose gradually” or “increased steadily” and describe a rate as “the highest” rather than “the highest percentage across all countries” when the comparison is limited to a particular year.
Grammatical Range and Accuracy: Band 5.0
You attempt some complex sentences, particularly when comparing several countries, but these structures are often difficult to control. For example, “while England and Australia started below 50% and 40% respectively, they reached above 60% in 2020, also Canada and Spain…” joins several clauses without clear grammatical links. There are also errors in articles, prepositions and verb forms, as in “started at 1970” and “then start increasing.” Punctuation is inconsistent, with missing spaces after commas and sentences that run on. These errors sometimes make relationships between ideas unclear. Practise writing shorter, complete sentences first, then combine them with accurate connectors such as “whereas” and “while.”
See this exact question answered at other band scores. The same prompt compared across bands.
Browse more IELTS Writing model answers or get your own writing scored by the same AI examiner.