Band 5.0 IELTS Writing Task 1 Model Answer
Overall Band Score: 5.0 · IELTS Momentum Workout · 2026-11-21
IELTS Writing Task 1 question
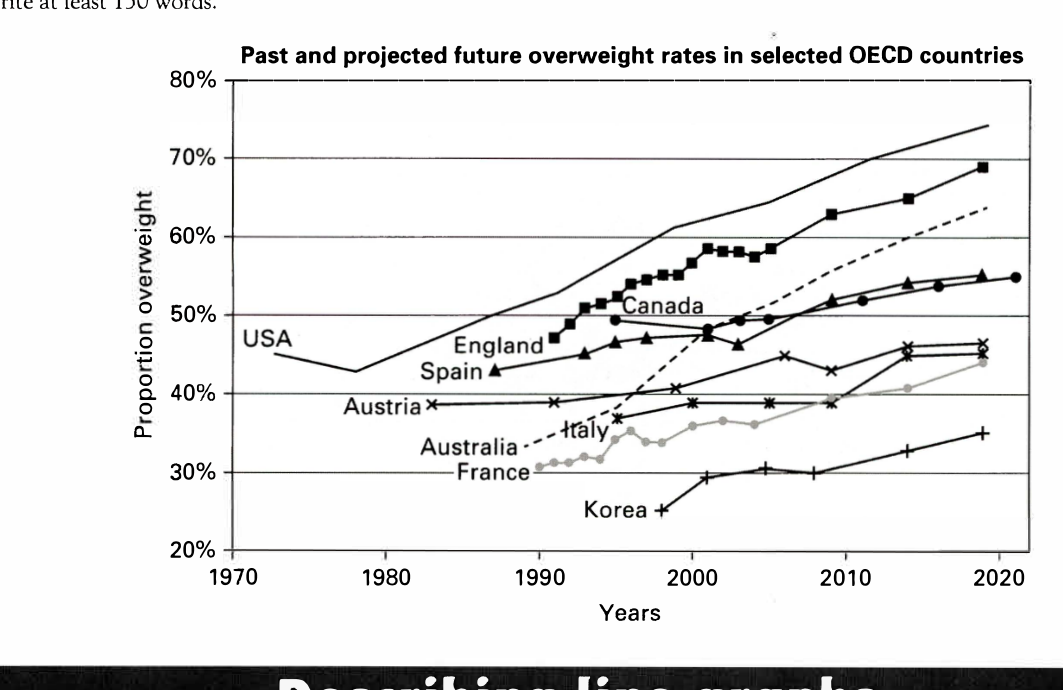
The line graph below shows past and current overweight rates, as well as a projected future overweight rate in nine selected countries.
Summarise the infonnation by selecting and reporting the main features, and make comparisons where relevant.
Past and projected future overweight rates in selected OECD countries
Student answer (Band 5.0)
The line chart illustrates the proporton of the past and projected future overweight rates in OECD countries (USA,England,Spain,Canada Austria,Italy,France and Korea)Australia between 1970 and 2020.
Overall,it is clear that the proportion of overweight increased in all the countries. USA consistently recorded the highest numbers while Korea the smallest figures .However, there was less rates in the past in every category although, there numbers increased dramatically.
In 1970,USA recorded 45% which rose drastically to 75%,in 2020.England also saw a rise in 1990 with no records between 1970 and 1980 athough,there was an increase in future. There was no records in the past but showed a modest rise in future from 45% to 70%.Australia showed a sharp rise from 32%to 70 %.Austria showed a modest rise from 40% to 42 %.Korea had the lowest numbers with no records in the past although percentages rose from 20 % to 35 %
In conclusion, although all the countries recorded an upward trend there was minimum proportion in thebpast than the projected future.
AI examiner evaluation
| Criterion | Band |
|---|---|
| Task Achievement / Task Response | 4.5 |
| Coherence and Cohesion | 5.5 |
| Lexical Resource | 5.5 |
| Grammatical Range and Accuracy | 5.0 |
| Overall | 5.0 |
Task Achievement / Task Response: Band 4.5
You identify the broad upward trend and correctly note that the USA is highest and Korea lowest, which gives the response a relevant starting point. However, the overview is weakened by the claim that every country increased: several series fluctuate, and the chart includes historical and projected figures rather than a simple past-versus-future comparison. Coverage is also incomplete and sometimes inaccurate. For example, Australia is described as rising from 32% to 70%, whereas the chart shows roughly 34% to 64%; Austria rises to about 46.5%, not 42%. Spain, Canada, Italy and France receive little or no meaningful comparison, and the statement about England is unclear. Select the main high and low figures, compare several countries, and report the trends more precisely.
Coherence and Cohesion: Band 5.5
The response has a recognisable structure: an introduction, an overview, a paragraph of details and a concluding sentence. This helps the reader identify the intended stages of the answer. However, progression within the detail paragraph is difficult to follow because countries are listed in quick succession without a consistent comparison or clear grouping. Some links are also inaccurate or repetitive, particularly the repeated use of “although” and “there was no records,” which makes relationships between ideas unclear. The conclusion largely repeats the overview rather than adding a useful synthesis. Organise the details into groups, such as the highest-rate countries and the lower-rate countries, and use clear transitions to show comparisons and changes over time.
Lexical Resource: Band 5.5
You use some relevant chart vocabulary, including “proportion,” “recorded,” “rise,” “sharp rise” and “upward trend,” so the topic is generally clear. However, the range is limited and several expressions are imprecise or awkward, such as “highest numbers,” “less rates” and “minimum proportion.” There are also spelling and spacing errors, including “proporton” and “althought,” which reduce the accuracy of the presentation. Repetition of “rise” and “increased” limits variety. Aim for precise terms such as “percentage,” “rate” and “figure,” and use collocations like “the rate climbed to” or “remained the lowest.” Check spelling and country-name punctuation during proofreading.
Grammatical Range and Accuracy: Band 5.0
You attempt some longer sentences and use past-tense verbs such as “recorded,” “rose” and “showed.” However, the range of sentence structures is limited, and attempts to combine ideas often produce errors that make the meaning difficult to follow. Examples include “although, there numbers increased dramatically” and “There was no records,” where clause structure and agreement are faulty. The sentence about England also lacks a clear grammatical connection between the absence of earlier data and its later increase. Punctuation is inconsistent, with missing spaces after commas and full stops. Practise writing shorter, complete comparisons first, then combine them using accurate clauses and consistent punctuation.
See this exact question answered at other band scores. The same prompt compared across bands.
Browse more IELTS Writing model answers or get your own writing scored by the same AI examiner.