Band 5.0 IELTS Writing Task 1 Model Answer
Overall Band Score: 5.0 · IELTS Momentum Workout · 2026-11-21
IELTS Writing Task 1 question
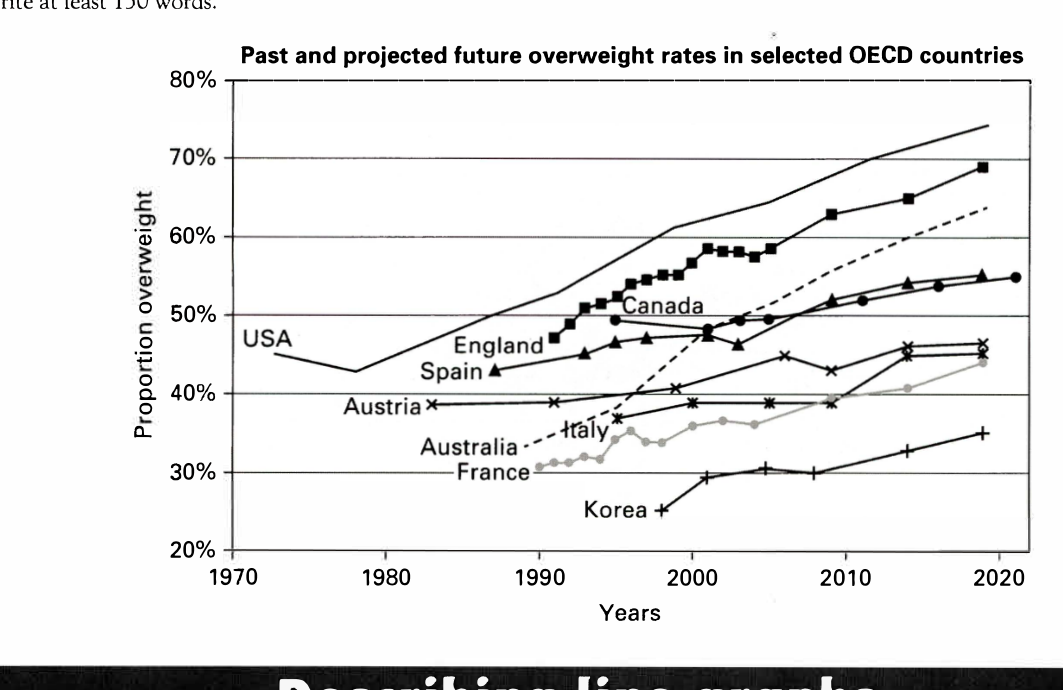
The line graph below shows past and current overweight rates, as well as a projected future overweight rate in nine selected countries.
Summarise the infonnation by selecting and reporting the main features, and make comparisons where relevant.
Past and projected future overweight rates in selected OECD countries
Student answer (Band 5.0)
The line graph compares past and now overweight percentage, it also projected future overweight portion ine nine particular countries.
Overall it is clear that, in 1970 Usa had the highest obese people, followed by Austria in 1982 and the lowest number of people suffer from obese in Korea in 1997.
In 1972, those citizens who lived in USA had the highest number of people who is suffered from excessive weight of their bodies at around 45%, after that it decreased for some year however it also goes up from 1977. Furthermore, Austria's people started suffering obese from 1982 at around 39% and also Spain, England, Australia, France citizens are obese in some year.
In addition, Australia starts in 1986 at 32%, followed by France at 30% in 1989 and also Korea in 1998 at around 15%. England has the second highest number of people by overweight starts from 1990 at 47% and 69% of people in 2020.
In conclusion, USA had the highest number in overall time, followed by England and Canada, however Canada goes up and down in relative years.
AI examiner evaluation
| Criterion | Band |
|---|---|
| Task Achievement / Task Response | 4.5 |
| Coherence and Cohesion | 5.0 |
| Lexical Resource | 5.0 |
| Grammatical Range and Accuracy | 5.0 |
| Overall | 5.0 |
Task Achievement / Task Response: Band 4.5
You identify the graph’s general subject and make an attempt to summarise trends, but the response reports several inaccurate or unsupported details and does not select the main features clearly. For example, Korea is described as having the lowest rate in 1997, although its data begin in 1998; its rate is about 25%, not 15%. Australia begins around 1990 at 34%, rather than 1986 at 32%, and France begins around 1991, not 1989. The overview also says the USA was highest “in 1970,” when the graph’s USA figure is from 1972, and the claim that Austria followed it is not a meaningful comparison across different starting years. Focus on the overall rise in most countries and the highest and lowest rates near the end.
Coherence and Cohesion: Band 5.0
The response has a basic paragraph structure, with an introduction, an overview, supporting paragraphs and a concluding sentence. This gives the reader some sense of organisation. However, the progression between ideas is not consistently clear: the second paragraph moves from the USA to Austria and then lists several countries without explaining their relative trends. The next paragraph repeats some of this information and introduces further starting dates, while the conclusion restates rankings rather than drawing together the main pattern. Linking phrases such as “Furthermore” and “In addition” are used, but they do not always show a clear relationship between the points. Group countries by comparable trends or by their final rates, and use references such as “these figures” only when their meaning is clear.
Lexical Resource: Band 5.0
You use some relevant vocabulary, including “line graph,” “percentage,” “highest,” “decreased” and “goes up and down,” so the topic is generally recognisable. However, the range is limited and several expressions are inaccurate or unnatural, sometimes making the meaning difficult to follow. For instance, “overweight portion” and “people who is suffered from excessive weight of their bodies” are awkward ways to describe the data, and “number of people” is misleading when the graph shows proportions. “Obese” is also used as a noun in “suffering obese.” Aim for precise chart language such as “the proportion of people who were overweight” and “the rate rose.” Avoid repeating “number of people” when reporting percentages.
Grammatical Range and Accuracy: Band 5.0
You attempt both simple and longer sentences, and the overall message can usually be understood. However, errors are frequent, particularly in verb forms, agreement and sentence construction. The opening sentence joins two independent clauses with a comma: “The line graph compares …, it also projected …”; use a full stop or a suitable conjunction. In “people who is suffered,” the verb form and agreement are incorrect, while “England has … starts from 1990” combines incompatible verb structures. Tense use also shifts between past and present, as in “Australia starts” and “USA had.” Practise forming clear past-tense descriptions of historical data and use present tense only for the graph’s general content. Check articles and sentence boundaries when editing.
See this exact question answered at other band scores. The same prompt compared across bands.
Browse more IELTS Writing model answers or get your own writing scored by the same AI examiner.