Band 5.0 IELTS Writing Task 1 Model Answer
Overall Band Score: 5.0 · IELTS Momentum Workout · 2026-11-22
IELTS Writing Task 1 question
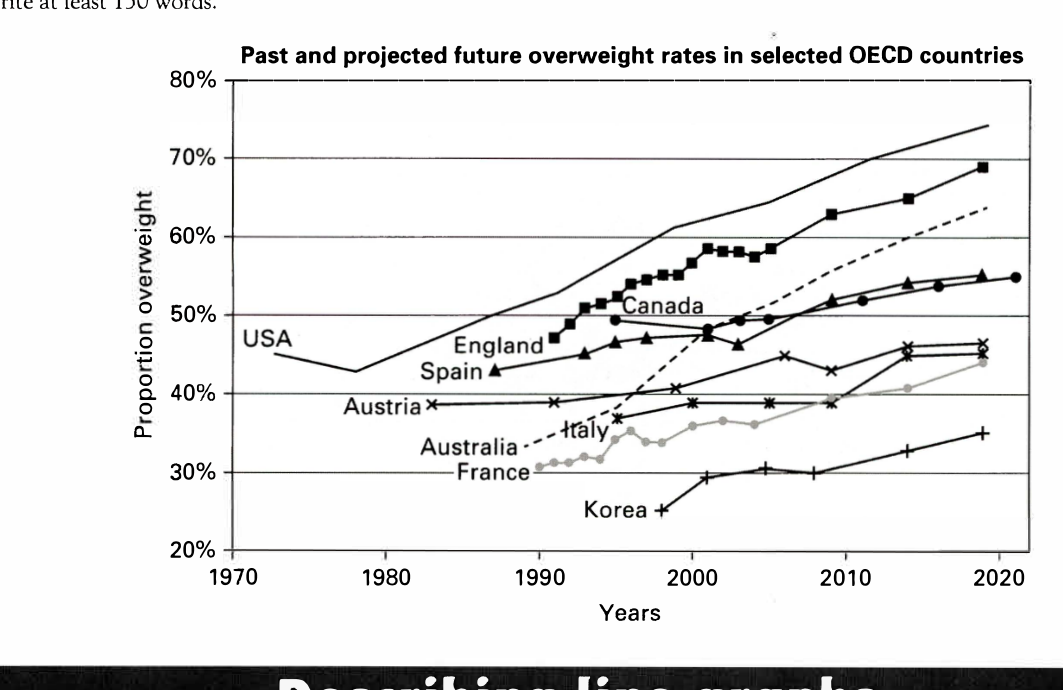
The line graph below shows past and current overweight rates, as well as a projected future overweight rate in nine selected countries.
Summarise the infonnation by selecting and reporting the main features, and make comparisons where relevant.
Past and projected future overweight rates in selected OECD countries
Student answer (Band 5.0)
This line chart illustrated the oberweighted different nine countries,in which there is different between past and the current overweight rates in selected oced countries like usa, england, canada, spain, autria, Australia, italy, france, korea.
Firstly like to talk about the USA around 1972 to 1979 there is decreased in the rate but after that there is drastically increased in the weight throughout 2020 and it will reach to the 75% .That might suggest over the year in the usa overweight rate is increased compared to the other countries. In contrast korea have a less overweight rates compared to others in1998 it is around 15% then it increased 30% in 2000 then over the year it maintain the same ratio, however in 2009 it will incresed and currently in 2020 it rach approximately 35%. ragardly talk about Australia in 1989 the ratio approximately 29% but it will incresed drastically in 1995 and continuously till 2020 and rech approximately 65% . In engalnd the weight is increased but in small amount changes can seen around 1990 it is approximately 49% but continuously incersed and rach to 70%. canda demostrate thier are no much changes are generated related to the weight around 1995 the rate is 50% but in 2020 rach approximately 55% wich is normal compared to other countries .
spian demonstrate a bird like graph in 1986 it will gradually increse and than decresed in 2003 almost reach 43% but then it will incresed reched approximately 55%.france have a zig zak type of graph and austria not have much incresed in the weight .
overall , to put it in a nutshell, i put down my pen this graph demonstrate the different yesrs throught the how much population is over weighted , in this vast chnages can seen on the usa in contasrt korean has a lesst increased compared with other countries.
AI examiner evaluation
| Criterion | Band |
|---|---|
| Task Achievement / Task Response | 5.5 |
| Coherence and Cohesion | 5.0 |
| Lexical Resource | 5.0 |
| Grammatical Range and Accuracy | 5.0 |
| Overall | 5.0 |
Task Achievement / Task Response: Band 5.5
You identify several relevant countries and report the broad pattern that the USA rises to the highest level while Korea remains comparatively low. You also include approximate figures for the USA, Australia, England and Canada. However, the overview is repeated rather than clearly summarising the main features, and some details are inaccurate: Korea begins at about 25%, not 15%, and rises gradually rather than reaching 30% in 2000 and then staying unchanged. Australia starts near 34%, not 29%, and Spain’s dip is around 2003 at roughly 46%, not 43%. France and Austria are mentioned only vaguely. To strengthen the response, give a concise overview of the overall rises and the highest and lowest countries, then select accurate comparisons across the series.
Coherence and Cohesion: Band 5.0
There is some organisation: the response begins with an introduction, discusses several countries in the main paragraph, and ends with a concluding paragraph. Basic linking expressions such as “In contrast,” “however” and “overall” show an attempt to connect ideas. However, the progression is difficult to follow because many countries are crowded into one long paragraph, while France and Austria receive only brief, disconnected comments. The final sentence repeats the USA–Korea comparison without adding a clear summary. Some transitions, such as “Firstly like to talk about,” do not form a clear link, and punctuation makes boundaries between ideas hard to identify. Group countries by comparable trends, use separate overview and detail paragraphs, and connect each comparison explicitly.
Lexical Resource: Band 5.0
You use some task-related vocabulary, including “rate,” “increased,” “decreased,” “approximately” and “compared,” so the reader can recognise the subject and several trends. However, the range is limited and repeated, and frequent spelling and word-choice problems sometimes make the meaning difficult to interpret. Examples include “oberweighted,” “bird like graph,” “zig zak type of graph” and “vast chnages.” Some expressions are not suitable for describing data, such as “put down my pen” and “normal compared to other countries.” Use precise trend language and accurate country names, and check spelling carefully. A wider set of terms such as “proportion,” “rose steadily,” “fluctuated” and “remained relatively stable” would help describe the chart more clearly and concisely.
Grammatical Range and Accuracy: Band 5.0
The response attempts to describe changes over time and uses some longer sentences with contrast, for example, “In contrast korea have a less overweight rates compared to others.” However, the range is limited, and frequent errors in sentence structure, tense, agreement and punctuation can make relationships between ideas unclear. Examples include “there is decreased,” “Korea have,” “it will reach,” and “the weight is increased”; these forms do not consistently express past trends or projections accurately. Several sentences run together without full stops, while others lack a clear subject or verb. Practise forming accurate past-tense descriptions and use simple, controlled sentences before adding clauses. Check subject–verb agreement, articles and sentence boundaries during editing.
See this exact question answered at other band scores. The same prompt compared across bands.
Browse more IELTS Writing model answers or get your own writing scored by the same AI examiner.