Band 5.5 IELTS Writing Task 1 Model Answer
Overall Band Score: 5.5 · IELTS Momentum Workout · 2026-11-22
IELTS Writing Task 1 question
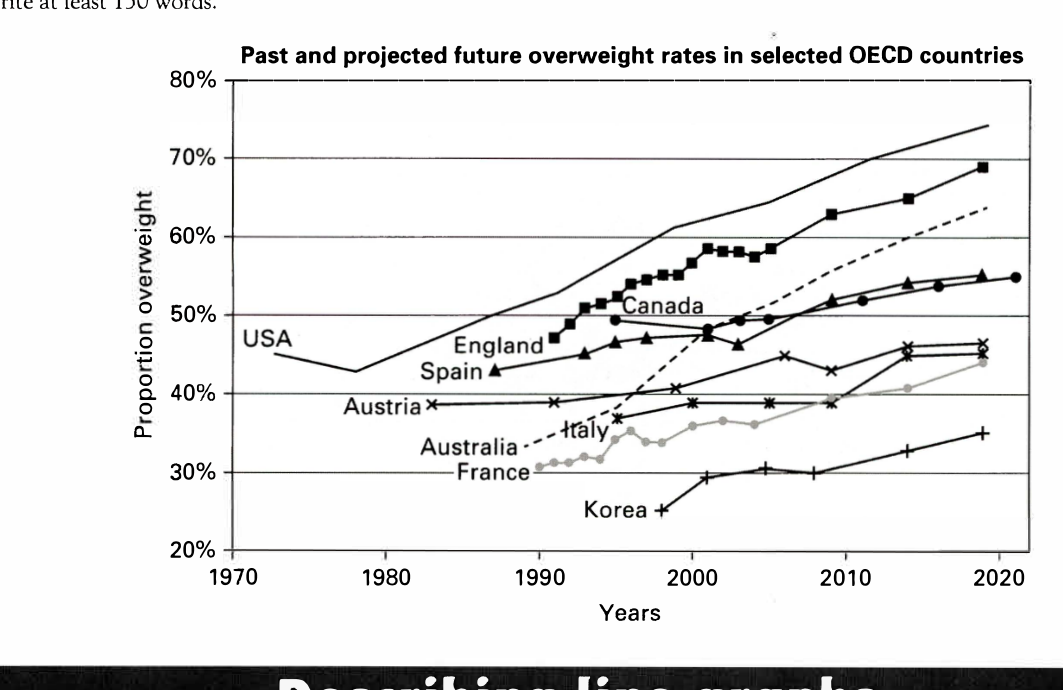
The line graph below shows past and current overweight rates, as well as a projected future overweight rate in nine selected countries.
Summarise the infonnation by selecting and reporting the main features, and make comparisons where relevant.
Past and projected future overweight rates in selected OECD countries
Student answer (Band 5.5)
The line graph illustrates obese percentages for four decades initiated in 1970 to 2020 in nine chossen OECD countries which are USA, England, Canada, Spain, Austria, Italy, Australia, France and lastly Korea.
Overall the USA, England and Australia are the countries with the highest overweight rates, Canada and spain rank second, while Eureopean countries such as Austria, France and Italy comes in the third place with a slight climb wheras Korea have the lowest overweight rates.
In 1970, USA have the highest percentage of fat people with 45% it witnessed a substantial climb as well as England and Australia over the next four decades. while Canada and Spain started with high rate relatively (42%, 49%) and rose by 5% to 10%. For Austria, France and Italy have a slight increase in percentages. In contrast with Korea the rates start in 1999 with the lowest obese proportion 25% and rose to 35% approximately over the next. two decades.
AI examiner evaluation
| Criterion | Band |
|---|---|
| Task Achievement / Task Response | 5.5 |
| Coherence and Cohesion | 6.0 |
| Lexical Resource | 5.5 |
| Grammatical Range and Accuracy | 5.0 |
| Overall | 5.5 |
Task Achievement / Task Response: Band 5.5
You identify the broad pattern that rates generally rise and correctly note that Korea remains the lowest, increasing from about 25% to 35%. However, the overview is not consistently accurate: the USA, England and Australia are high, but Canada and Spain do not form a clear second tier throughout, and Austria, France and Italy are not all grouped reliably as a third tier. Several details are also misreported or too vague: Canada begins at about 50%, not 42%, and Spain begins at roughly 43%, not 49%. The response mentions the USA’s 45% starting point but does not give a clear end figure or compare the countries’ final rates. To strengthen the report, select accurate start/end comparisons and describe the main ranking changes more precisely.
Coherence and Cohesion: Band 6.0
The response has a recognisable structure: an introduction, an overall summary and a paragraph of selected details. This gives the reader a basic route through the information. However, the progression within the final paragraph is difficult to follow because several countries are grouped together without enough detail, and the sentence beginning “For Austria, France and Italy” is not connected clearly to the preceding comparison. Linking is also sometimes mechanical or awkward, as in “In contrast with Korea,” while the full stop in “over the next. two decades” interrupts the sentence. Organise the body around clearer groups—for example, the highest rates and the lower-rate countries—and use transitions that show how each comparison relates to the overview.
Lexical Resource: Band 5.5
You use some relevant vocabulary for describing trends, including “substantial climb,” “slight increase” and “lowest … proportion,” and the topic is generally understandable. However, word choice and spelling are often imprecise. “Obese percentages” and “fat people” are less suitable than neutral chart language such as “overweight rates” or “the proportion of people who were overweight.” “Rank second” and “comes in the third place” make the comparisons sound more definite than the data supports. There are also noticeable spelling errors, including “chossen,” “Eureopean” and “wheras.” Aim for accurate, neutral terms and check spelling; this will make your descriptions clearer and more appropriate for an academic report.
Grammatical Range and Accuracy: Band 5.0
You attempt both simple and more extended sentences, and the overall meaning can usually be understood. However, errors in verb forms, agreement and sentence construction are frequent enough to make some parts awkward. For example, “USA have the highest percentage” needs subject–verb agreement, and “European countries … comes” also has an agreement error. The opening phrase “for four decades initiated in 1970 to 2020” is not grammatically well formed, while “For Austria, France and Italy have a slight increase” has an incomplete or misconstructed clause. Punctuation also causes problems, particularly the lower-case “while” after a full stop and the break in “over the next. two decades.” Practise accurate past-tense reporting and build comparisons with complete clauses.
See this exact question answered at other band scores. The same prompt compared across bands.
Browse more IELTS Writing model answers or get your own writing scored by the same AI examiner.