Band 6.0 IELTS Writing Task 1 Model Answer
Overall Band Score: 6.0 · IELTS Momentum Workout · 2026-11-11
IELTS Writing Task 1 question
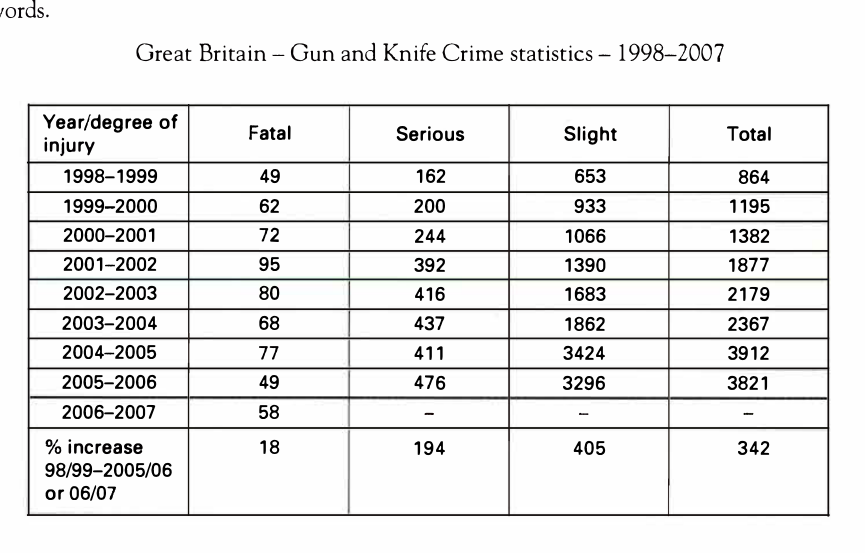
The table shows the number of fatal, serious and slight injuries resulting from gun and knife crime in Great Britain from 1998 to 2007 and the percentage increase for each degree of injury over the period.
Summarise the information by selecting and reporting the main features, and make comparisons where relevant.
Great Britain - Gun and Knife Crime statistics - 1998-2007
Student answer (Band 6.0)
The table illustrates the number of injuries, such as fatal, serious, and slight, which are caused by crime with guns and knives in Great Britain over the period of 9 years from 1998 to 2007 and also gives the proportional rise in such injuries over the years.
Overall, it is clear from the trend that slight injuries are more common and fatal injuries are fewer in number. The years 2004 to 2005 have the highest number of injuries.
The number of injuries has increased from 864 in 1998 to 3821 in 2006. A slight decrease in fatal and non-fatal injuries occurred from 2006 to 2007, with an increasing rate of serious injuries.
Over the period, fatal injuries increased by 18%, serious by 194%, and slight injuries by 405%.
AI examiner evaluation
| Criterion | Band |
|---|---|
| Task Achievement / Task Response | 5.0 |
| Coherence and Cohesion | 6.0 |
| Lexical Resource | 6.0 |
| Grammatical Range and Accuracy | 6.0 |
| Overall | 6.0 |
Task Achievement / Task Response: Band 5.0
You identify the main pattern that slight injuries were the most numerous and fatal injuries the least, and you report the percentage increases accurately. However, the response only partially covers the table: it gives little detail about how the figures changed across the years, and the overview claim that 2004–05 had the highest number is inaccurate, since the total peaked at 3,912 that year but fell to 3,821 in 2005–06, while 2006–07 has no total shown. The statement that injuries rose from 864 in 1998 to 3,821 in 2006 also skips the peak and does not clarify the year labels. The response is 22 words below the required minimum, limiting the opportunity to select and explain key comparisons. Add a fuller account of the overall rise, the late-period peak and decline, and the missing final-year data.
Coherence and Cohesion: Band 6.0
The response has a clear overall arrangement: it introduces the table, gives an overview, then presents figures and percentage changes. This makes the main points easy to follow, and phrases such as “Overall” and “Over the period” help signal the stages of the summary. However, the progression is quite compressed, with several distinct trends packed into short statements. For example, the sentence about changes from 2006 to 2007 combines fatal, non-fatal and serious injuries without making clear that the table provides only fatal figures for 2006–07. The link between the overview and the later figures could also be clearer. Use separate sentences or a more deliberate grouping of the injury categories, and make references to years and totals precise.
Lexical Resource: Band 6.0
You use an adequate range of task-related vocabulary, including “proportional rise,” “slight decrease,” and “increasing rate,” and the meaning is generally clear. Some choices are imprecise or unnatural for describing a statistical table. “Injuries … caused by crime with guns and knives” is wordy; “injuries resulting from gun and knife crime” is more direct. “The years 2004 to 2005 have the highest number of injuries” would be clearer as “the total peaked in 2004–05.” Also, “non-fatal injuries” groups serious and slight injuries together, obscuring the categories shown. Aim for precise terms such as “total,” “figure,” “category,” and “rose/fell,” and avoid wording that could blur distinctions between the data series.
Grammatical Range and Accuracy: Band 6.0
You use a mix of simple and more complex sentence forms, and most sentences communicate their meaning without difficulty. The opening sentence uses a relative clause (“which are caused by…”), while the overview and later comparisons are expressed in shorter structures. Some grammatical choices are awkward or reduce precision. In “The years 2004 to 2005 have the highest number,” the plural subject and present-tense verb do not fit naturally with a past-period statistic; “The total was highest in 2004–05” is more appropriate. “The number of injuries has increased from 864 in 1998 to 3821 in 2006” also shifts to the present perfect despite describing completed years. Keep tense consistent when reporting historical data, and use concise sentence patterns to make comparisons easier to follow.
See this exact question answered at other band scores. The same prompt compared across bands.
Browse more IELTS Writing model answers or get your own writing scored by the same AI examiner.