Band 5.0 IELTS Writing Task 1 Model Answer
Overall Band Score: 5.0 · IELTS Momentum Workout · 2026-11-15
IELTS Writing Task 1 question
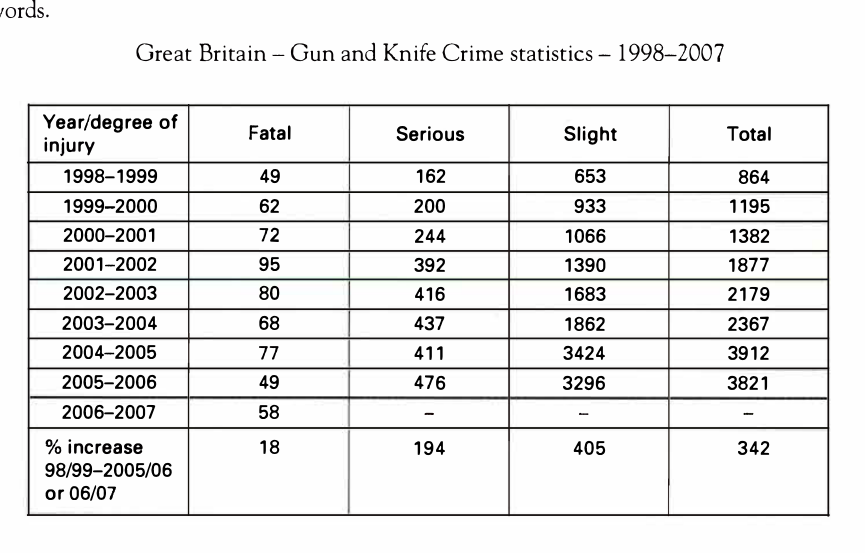
The table shows the number of fatal, serious and slight injuries resulting from gun and knife crime in Great Britain from 1998 to 2007 and the percentage increase for each degree of injury over the period.
Summarise the information by selecting and reporting the main features, and make comparisons where relevant.
Great Britain - Gun and Knife Crime statistics - 1998-2007
Student answer (Band 5.0)
The table allustrates the number of fatak, serious and slight injuries in great britain through knife and guns from 1998 to 2007.
Overall the table shows five columns one is for years other for fatal then serious and in last two columns slight and total showed slight showed in previous column then total
The tables Allustrates that in first part fatal injuries which had 49 crime number in year of 1998 to 1999 crime number But it rises up significantly in upcoming years like 1999 to 2002 then it gets noticable declined in year of 2003 to 2004.after this downfall it never get same position.Number of serious is written in second column which had it's least number on 162 in first year after that it never gets any decline because it always rises from its previous number Although it slightly decreases in 2004 to 2005 after this short decline it also gets dramaticaly growth in second last year and in last year its result not showed. Before total result slight injuries is showed in 3rd column which was its highest number on its first year like serious but it had also highest number from previous columns it gets a dramatical growth which is very high and significant growth and it ends on 3296 number in second last year.
In last colunm showed total number of injuries then in a last row all are showed with a unique number which is called increase percentage and it this row fatal 18, serious ,slight 405 and total have 342 numbers
AI examiner evaluation
| Criterion | Band |
|---|---|
| Task Achievement / Task Response | 4.5 |
| Coherence and Cohesion | 4.5 |
| Lexical Resource | 5.0 |
| Grammatical Range and Accuracy | 5.0 |
| Overall | 5.0 |
Task Achievement / Task Response: Band 4.5
You identify the table’s subject and make some relevant observations, including that serious injuries rise overall and that slight injuries reach 3,296 in 2005–06. However, the overview is not a clear summary of the main trends: the paragraph describing the columns does not explain the key pattern, and the account of fatal injuries is vague. Some details are inaccurate or confusing. For example, slight injuries did not have their highest figure in the first year, and serious injuries did not rise continuously because they fell from 437 to 411 in 2004–05. The final percentage row is also reported incompletely: the increases are 18%, 194%, 405% and 342%. Select the strongest overall comparisons and report them accurately to make the response more fully address the task.
Coherence and Cohesion: Band 4.5
The response has some organisation: it begins with an introduction and then discusses fatal, serious and slight injuries before mentioning the total and percentage row. This gives the reader a basic sense of the table’s categories. However, progression is difficult to follow because the overview is replaced by a lengthy description of the columns, and several ideas are joined into long, unclear sentences. Phrases such as “Before total result slight injuries is showed in 3rd column” interrupt the flow rather than guide the reader. Linking words such as “after that” and “although” are used, but the relationships they signal are sometimes unclear or inaccurate. Use a concise overview followed by clearly separated comparisons, and make each paragraph focus on a coherent set of trends.
Lexical Resource: Band 5.0
You use some relevant vocabulary for describing data, including “rises,” “declined,” “growth” and “percentage,” so the topic is generally recognisable. However, the range is limited and several words or phrases are repeated, particularly “number,” “column” and “growth.” There are also noticeable spelling and word-choice problems, such as “allustrates,” “fatak,” “noticable” and “dramaticaly,” which make parts of the response harder to read. Some expressions are not natural for statistical reporting, for example “gets same position” and “its highest number on its first year.” Build a more precise set of trend terms and use standard collocations such as “the figure rose,” “reached a peak” and “recorded a decline.”
Grammatical Range and Accuracy: Band 5.0
You attempt longer sentences and use some subordinate clauses, for example “Although it slightly decreases in 2004 to 2005…” This shows an effort to go beyond simple statements. However, the range remains limited, and complex sentences are often faulty or difficult to interpret. Errors include missing or incorrect articles and prepositions (“in year of 1998 to 1999”), agreement and verb forms (“the table shows five columns… showed”), and sentence boundaries, as in the long passage beginning “The tables Allustrates that…”. Punctuation is also inconsistent, with missing spaces after full stops and commas. Practise writing shorter, complete sentences first, then combine related comparisons using accurate clauses and consistent past-tense forms.
See this exact question answered at other band scores. The same prompt compared across bands.
Browse more IELTS Writing model answers or get your own writing scored by the same AI examiner.