Band 4.5 IELTS Writing Task 1 Model Answer
Overall Band Score: 4.5 · IELTS Momentum Workout · 2026-11-16
IELTS Writing Task 1 question
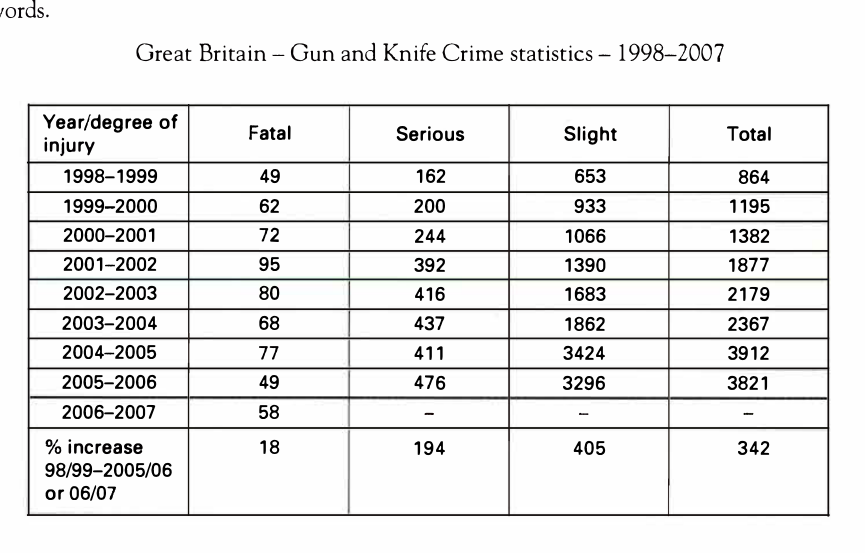
The table shows the number of fatal, serious and slight injuries resulting from gun and knife crime in Great Britain from 1998 to 2007 and the percentage increase for each degree of injury over the period.
Summarise the information by selecting and reporting the main features, and make comparisons where relevant.
Great Britain - Gun and Knife Crime statistics - 1998-2007
Student answer (Band 4.5)
as i can see in graph everything looks clear . if talk about 1998 to 1999 fatal is 49 and serious 162 , slight also mention their 653 now will be total 864 . now we move in another section which is dedicate years of 1999 to 2000 there we can see The graph increased fatal 62 and serious 200 and slight 933 total now 1195 that is too much better than year of [redacted phone] . now we lets move another years of section 2000 to 2001 there fatal is 72 and serious 244 and slight 1066 now we can see total of this year 1382 this is more The graph increased for this year . now we can go 2001 to 2002 that is also going same but he had more The graph increased number is 1877 now turn in 2002 to 2003 fatal is 80 and serious 416 slight is 1683 total 2179 The graph increased that gone very long still now really looks top or improvement
AI examiner evaluation
| Criterion | Band |
|---|---|
| Task Achievement / Task Response | 4.0 |
| Coherence and Cohesion | 4.5 |
| Lexical Resource | 4.5 |
| Grammatical Range and Accuracy | 4.5 |
| Overall | 4.5 |
Task Achievement / Task Response: Band 4.0
You identify several figures accurately for 1998–99 through 2002–03, including the totals of 864, 1,195, 1,382, and 2,179, and you recognise that the overall numbers generally rise. However, the response mainly lists early-year data rather than summarising the table’s most important features. It omits the later years, where the total peaks at 3,912 in 2004–05 before falling to 3,821, and gives no overview of the percentage increases. Some descriptions, such as “that is too much better” and “improvement,” are unclear and do not explain what the figures show. To address the task more fully, select key trends, compare injury categories, and include a concise overview.
Coherence and Cohesion: Band 4.5
The response follows the table’s years in chronological order, and phrases such as “now we move” and “now turn” signal that you are moving to another period. This gives the reader a basic sequence. However, the repeated transitions make the writing sound like a running commentary, and there is no clear introduction, overview, or paragraph structure to guide the reader through the main features. Several sentences run together, while references such as “that is also going same” are difficult to interpret. Grouping the data into an opening overview and one or two paragraphs comparing trends would create clearer progression. Use linking expressions to show meaningful comparisons, rather than repeating “now” for each year.
Lexical Resource: Band 4.5
You use some relevant data vocabulary, including “fatal,” “serious,” “slight,” “total,” and “increased,” so the reader can identify the categories being discussed. However, the range is basic and repetitive, and several phrases are unnatural or unclear, such as “that is too much better,” “going same,” and “gone very long.” “Graph” is also not the most precise label for the table. Choose accurate trend language and collocations, for example, “the total rose,” “the figure continued to increase,” or “the number reached a peak.” Avoid evaluative terms such as “improvement,” since an increase in crime injuries is not necessarily an improvement. More precise vocabulary would make the comparisons easier to understand.
Grammatical Range and Accuracy: Band 4.5
You communicate a sequence of figures using mostly simple clauses, but the range of sentence structures is narrow and errors occur throughout. For example, “if talk about 1998 to 1999 fatal is 49” lacks a correctly formed introductory clause and clear sentence structure; “the graph increased fatal 62” also has an incorrect verb pattern. Articles and prepositions are often missing or awkward, as in “in another section which is dedicate years.” Capitalisation and punctuation are inconsistent, with sentence boundaries often unclear. These problems sometimes make the intended relationship between figures difficult to follow. Practise forming complete sentences with a clear subject and verb, and use punctuation to separate each year’s information. Accurate simple sentences should come before attempts at longer structures.
See this exact question answered at other band scores. The same prompt compared across bands.
Browse more IELTS Writing model answers or get your own writing scored by the same AI examiner.