Band 5.0 IELTS Writing Task 1 Model Answer
Overall Band Score: 5.0 · IELTS Momentum Workout · 2026-11-19
IELTS Writing Task 1 question
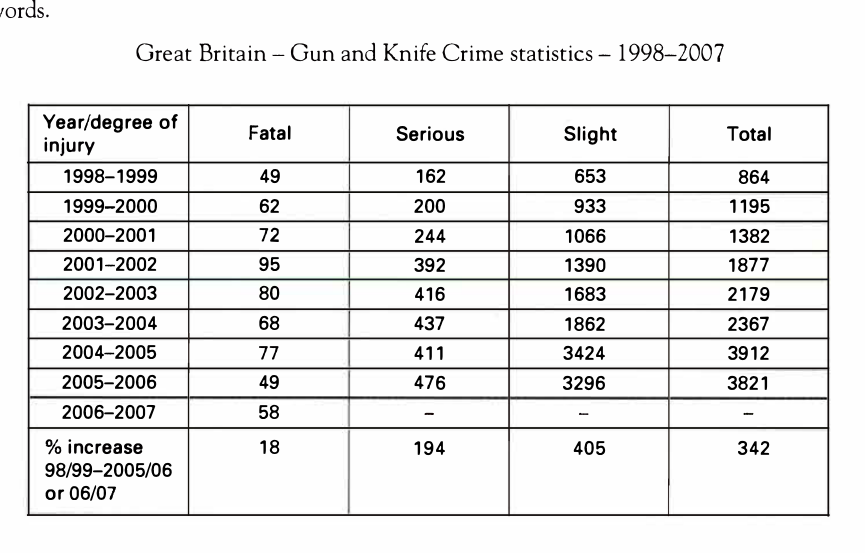
The table shows the number of fatal, serious and slight injuries resulting from gun and knife crime in Great Britain from 1998 to 2007 and the percentage increase for each degree of injury over the period.
Summarise the information by selecting and reporting the main features, and make comparisons where relevant.
Great Britain - Gun and Knife Crime statistics - 1998-2007
Student answer (Band 5.0)
In the given table the information is about crime which cause injury from gun or knife in Great Britain from the year 1998 to 2007.There are three types of injuries given in the following table.Fatal,Serious and slight injuries.
First we Start from [redacted phone].There was 864 crime reported and 49 were Fatal,162 were serious and Slight injuries were 653.
From [redacted phone] there were 1195 Total crimes,62 were fatal injuries,200 were serious injuries and 933 were were slight injuries.
From [redacted phone] there were total 1382 crimes reported,72 were fatal injuries,244 were serious and 1066 were slight injuries.
From [redacted phone] there were 1877 crimes reported,95 were fatal injuries,392 were serious and 1390 were slight.
From [redacted phone] there were 2179 crimes reported,80 were fatal injuries,416 were serious and 1683 were slight.
From [redacted phone] there were 2367 crimes reported,68 were fatal injuries,437 were serious and 1862 were slight.
From [redacted phone] there were 3912 crimes reported,77 were fatal injuries,411 were serious and 3424 were slight.
From [redacted phone] there were total 3821 crimes reported,49 were fatal,476 were serious and 3296 were slight.
From [redacted phone] there is only fatal injuries crimes are given in the table.
Then at last there is increase % comparison between 98/99-2005/2006 or 06/07.The fatal injuries increases 18%,serious were 194 and slight were 405.
AI examiner evaluation
| Criterion | Band |
|---|---|
| Task Achievement / Task Response | 4.5 |
| Coherence and Cohesion | 5.0 |
| Lexical Resource | 5.0 |
| Grammatical Range and Accuracy | 5.0 |
| Overall | 5.0 |
Task Achievement / Task Response: Band 4.5
You identify the table’s subject and report many figures accurately, including the totals and injury categories for most years. However, the response mainly lists data year by year rather than selecting and summarising the main features, so the task is only partly addressed. A clear overview is missing: for example, slight injuries were consistently the largest category and rose sharply, while fatal injuries fluctuated and ended close to their starting level. The final comparison is also incomplete: you give the increases for fatal, serious and slight injuries, but omit the 342% increase in the total, and do not attach figures to the 194% and 405% increases. The 2006–07 entry is correctly noted as having only fatal data. Prioritise an overview and key comparisons over a full inventory.
Coherence and Cohesion: Band 5.0
The response follows the table’s chronological order, which makes the figures relatively easy to locate, and the opening identifies the subject and categories. However, the repeated pattern of “From [year] there were…” creates a list rather than a clear progression from overview to selected details. There is little grouping or comparison between years, and the final sentence introduces percentage changes without clearly linking them to the earlier figures. Paragraphing is also limited: the opening, data summary and overall trends are not separated into purposeful sections. Organise the response into an introduction, a concise overview, and one or two paragraphs comparing the main changes; use linking expressions to show contrasts and trends rather than repeating the same year-by-year frame.
Lexical Resource: Band 5.0
You use relevant basic terms such as “fatal,” “serious,” “slight,” “total” and “increase,” so the reader can generally understand which figures you are describing. However, the vocabulary is repetitive and sometimes imprecise. Calling the figures “crimes reported” confuses crime incidents with injuries, while “there is only fatal injuries crimes” is an awkward way to describe the final row. The response also relies on repeated phrases such as “there were” and “reported,” with few alternatives for describing rises, falls or comparisons. Use more precise task vocabulary, for example “injuries,” “cases” where appropriate, “rose,” “fluctuated,” and “accounted for.” This would make the summary clearer and more suitable for an academic report without requiring unnecessarily complex wording.
Grammatical Range and Accuracy: Band 5.0
Most of the response uses short, simple sentence patterns, especially the repeated construction “From [year] there were…” This keeps many figures understandable, but the range is limited and attempts at more complex phrasing are not consistently controlled. For example, “There are three types of injuries given in the following table” is awkwardly formed, and “From 2006-2007 there is only fatal injuries crimes are given” has problems with clause structure, tense and agreement. There are also missing spaces after full stops and inconsistent punctuation around lists, which makes the text less polished. Practise accurate past-tense reporting and use a few controlled comparison structures, such as “while” or “whereas,” to combine related information. Check sentence boundaries and agreement during revision.
See this exact question answered at other band scores. The same prompt compared across bands.
Browse more IELTS Writing model answers or get your own writing scored by the same AI examiner.