Band 5.0 IELTS Writing Task 1 Model Answer
Overall Band Score: 5.0 · IELTS Momentum Workout · 2026-11-22
IELTS Writing Task 1 question
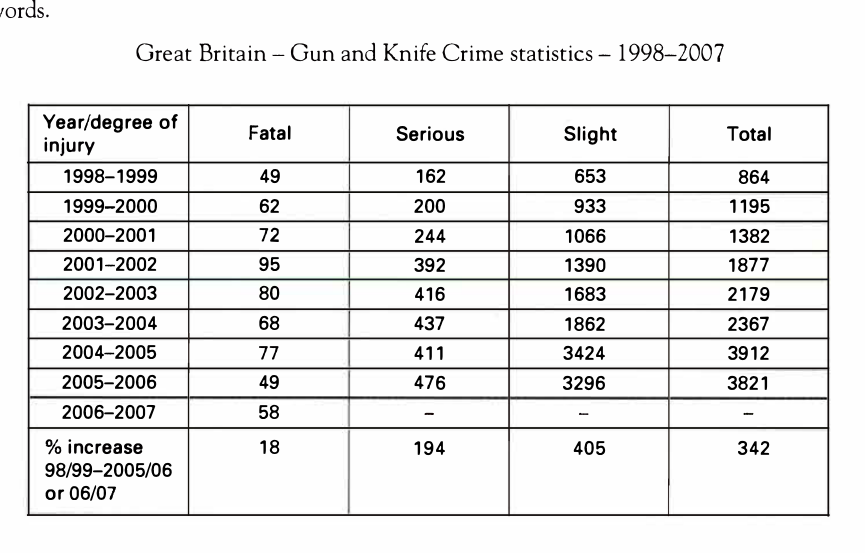
The table shows the number of fatal, serious and slight injuries resulting from gun and knife crime in Great Britain from 1998 to 2007 and the percentage increase for each degree of injury over the period.
Summarise the information by selecting and reporting the main features, and make comparisons where relevant.
Great Britain - Gun and Knife Crime statistics - 1998-2007
Student answer (Band 5.0)
The table illustrate the number of fetal, serious and slight injuries occur from the gun and knife crime in Great Britain between 1998 and 2007, whereas the percentage injury of each degree increase over the period.
Overall, the proportion of slight injury was considerably highest as comapred to fatal and serious over the period, whereas fatal injury demonstrate declined in year 2005 and 2007, however in serious injury we show drop down in [redacted phone].
To begin with, the people of Great Britain suffer from fatal injury was lower at 49, followed by 12 for serious and 653 for slight injury in year [redacted phone]. Moreover, in [redacted phone], all the three injuries occured with 62, 200 and 933 people and total proportion was 1195. In [redacted phone], fatal accounted for 72, with increased to 244 for serious and slight injury represented at 1066, followed by total 1382 people. Furthermore, in just three year the crime happened from gun and knife was 95 for fatal and serious and slight number was higher (392 and 1390) as compared to fatal. In [redacted phone], the injury like fatal, serious and slight contributed at 68, 437 and 1862 respectively.
In addition, in 2004, the figure of fatal had been 77, and slight was 3424, perhaps serious has been plunged at 411 from pervious year. In contrast, the serious and slight reached at 476 and 3296 respectively, fatal dropped to 49 which was good fro the community. In [redacted phone], the crime had been zero in proportion of serious and slight, followed by least number of people (58) in fatal. The total number of crime face by people was increasing over the period from 864 to 3912 in year [redacted phone], but in year [redacted phone] it slight declined to 3821. The percentage of fatfal at 18%, followed by 194% for serious and slight accounted for 405% which was the highest percent as compared to fatal and serious. The total number represented at 342% which had been lower than slight injury.
AI examiner evaluation
| Criterion | Band |
|---|---|
| Task Achievement / Task Response | 5.0 |
| Coherence and Cohesion | 5.0 |
| Lexical Resource | 5.0 |
| Grammatical Range and Accuracy | 5.0 |
| Overall | 5.0 |
Task Achievement / Task Response: Band 5.0
You identify the table’s subject and include an overview that slight injuries were the most numerous, as well as noting the rise and later fall in the total. However, the overview is not consistently accurate: fatal injuries did not simply decline in 2005 and 2007, and the table gives no serious or slight figures for 2006–07, so these should not be described as zero. Several figures are also misreported or unclear: 1998–99 serious injuries were 162, not 12, and the 2001–02 figures are presented as though 95 applied to both fatal and serious injuries. The percentage increases are reported, but the comparison is not clearly tied to the period shown. Select the main trends and check each figure against the table before writing.
Coherence and Cohesion: Band 5.0
The response has an introduction, an overview and two body paragraphs, and it generally moves from earlier to later years. This gives the reader some organisation. However, progression is weakened by a year-by-year list of figures rather than grouping the main trends, and several transitions do not clarify the relationship between ideas. For example, “In contrast” introduces figures that continue the chronology rather than a clear contrast, while “Furthermore, in just three year” does not identify the period precisely. The final paragraph combines annual data, totals and percentage increases, making its focus difficult to follow. Group the data into meaningful stages or categories, and use linking phrases only when they accurately signal the relationship between points.
Lexical Resource: Band 5.0
You use some relevant terms, including “fatal,” “serious,” “slight,” “total” and “percentage,” so the topic is recognisable. However, the range of accurate reporting language is limited, and repeated or awkward expressions sometimes make the meaning difficult to understand. Phrases such as “the people … suffer from fatal injury was lower” and “the crime had been zero in proportion” are not natural ways to describe table data. There are also spelling errors, including “comapred,” “pervious” and “fatfal,” and imprecise choices such as “proportion” when referring to counts. Build a small set of accurate trend verbs and comparison phrases, and check spelling and collocations during revision.
Grammatical Range and Accuracy: Band 5.0
You attempt longer sentences and use time expressions to organise the account, but complex structures are often faulty, and errors occur frequently enough to make some statements hard to interpret. For example, “The table illustrate” has incorrect subject–verb agreement, while “the number of … injuries occur” lacks an appropriate verb form. In “fatal injury demonstrate declined,” the verb construction is also incorrect. Articles and sentence structure are inconsistent, as in “the serious and slight reached at 476 and 3296.” These problems recur across the response, although the reader can understand some simple statements such as the total rising from 864 to 3912. Practise accurate basic clauses first, then add subordinate clauses while checking agreement, tense and verb patterns.
See this exact question answered at other band scores. The same prompt compared across bands.
Browse more IELTS Writing model answers or get your own writing scored by the same AI examiner.