Band 4.5 IELTS Writing Task 1 Model Answer
Overall Band Score: 4.5 · IELTS Complete Catalyst · 2026-11-16
IELTS Writing Task 1 question
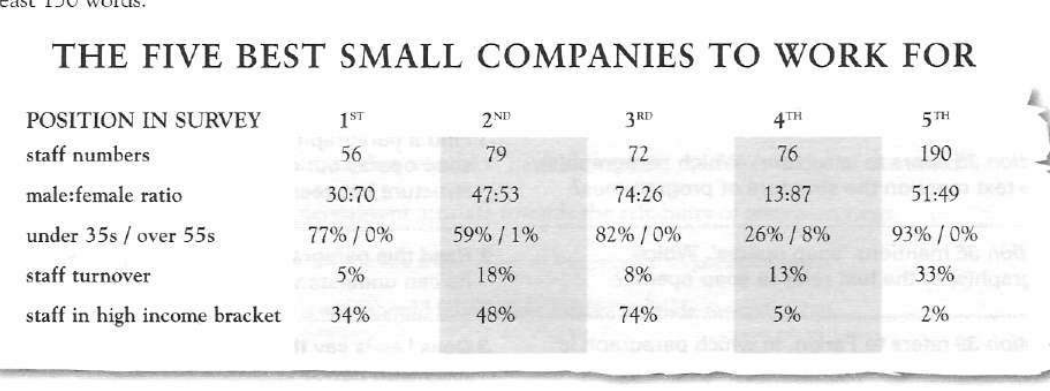
The table below gives information about the five small companies in Britain that came top in a survey of staff conducted by a national newspaper to find out which companies are the best to work for.
Summarise the information by selecting and reporting the main features, and make comparisons where relevant.
THE FIVE BEST SMALL COMPANIES TO WORK FOR
Student answer (Band 4.5)
The table below illustrates the information about the five five small companies in britain that came top in a survey of staff conducted by a national newspaper to find out which companies are the best for work.
This given graph that tells about the different types of data, such as, staff number, male or female ratio, under 35/ over 55, staff turnover and staff in high income bracket. And tells about the ratio of each data in the five best small companies to work for.
As we see, the staff number in five best companies, 1st companies there are 56 seats, 2nd 79 seats, 3rd 72 seats, 4th 76 seats, and in 5th 190 seats.Male : female ratio, in 1st company the ratio is 30:70, 2nd 47:53 ratio.3rd 74:26 ratio, 4th 13:87, and in last company 51:49 ratio. The percantage for under 35s/ over 55s, in 1st company 77%/ 0%, 2nd 59%/ 1%, 3rd 82%/0%, 4th 26%/8%, and in 5th company 93%/0%. The percantge of staff turnover, 5%, 18%, 8%, 13%, and 33%. The percentage of staff in high income bracket, 34%, 48%, 74%, 5%, and 2% in 5th company
AI examiner evaluation
| Criterion | Band |
|---|---|
| Task Achievement / Task Response | 4.0 |
| Coherence and Cohesion | 4.0 |
| Lexical Resource | 5.0 |
| Grammatical Range and Accuracy | 4.5 |
| Overall | 4.5 |
Task Achievement / Task Response: Band 4.0
You identify the table’s subject and report many of its figures accurately, including staff numbers, gender ratios, age groups and turnover. However, the response mainly lists data rather than selecting and summarising the main features. It gives no clear overview of notable patterns—for example, the fifth-ranked company has the most staff and the highest turnover, while the third has the largest proportion in the high-income bracket. The final high-income figures are also incomplete: the values for the first four companies are not clearly assigned, and the fifth company’s 2% is mentioned. The opening repeats the task wording, and “56 seats” misrepresents staff numbers. Focus on an overview and a few meaningful comparisons, rather than reproducing every category.
Coherence and Cohesion: Band 4.0
The response follows the table’s categories in a broadly understandable order, moving from staff numbers to gender, age, turnover and income. This gives the reader a basic route through the information. However, it is presented as one long block, with no clear paragraphing or distinct overview, and the repeated “As we see” and “and” do little to show relationships between the figures. Several sections become difficult to follow because values are compressed together, such as “3rd 74:26 ratio.4th 13:87,” and the final income figures are not clearly linked to each company. Use separate paragraphs for the overview and grouped comparisons, and connect related figures with clear comparative language.
Lexical Resource: Band 5.0
Your vocabulary is sufficient to name the main table categories, using terms such as “staff turnover,” “male:female ratio” and “high income bracket.” However, the range is limited and several choices are imprecise or repetitive. “Seats” is not an appropriate way to describe employees, and “This given graph that tells about” is awkward for introducing a table. The repeated use of “ratio” and “percentage” also makes the report sound like a list rather than a summary. Spelling errors such as “percantage” and “percantge” are noticeable. Use accurate reporting terms and verbs such as “employs,” “accounts for,” and “records,” and check spelling before submitting.
Grammatical Range and Accuracy: Band 4.5
The response relies mainly on simple, list-like sentence patterns, and frequent grammatical problems sometimes make the relationships between figures unclear. For example, “1st companies there are 56 seats” lacks a clear subject and has an incorrect plural construction, while “The percantage for under 35s/ over 55s, in 1st company 77%/ 0%” is a sentence fragment. The opening also has an incomplete construction: “This given graph that tells about…” Several sentences run figures together without adequate punctuation, as in “190 seats.Male : female ratio.” Aim for complete sentences with a clear subject and verb, and use consistent punctuation when separating company comparisons. A wider mix of accurate sentence structures would make the data easier to read.
See this exact question answered at other band scores. The same prompt compared across bands.
Browse more IELTS Writing model answers or get your own writing scored by the same AI examiner.